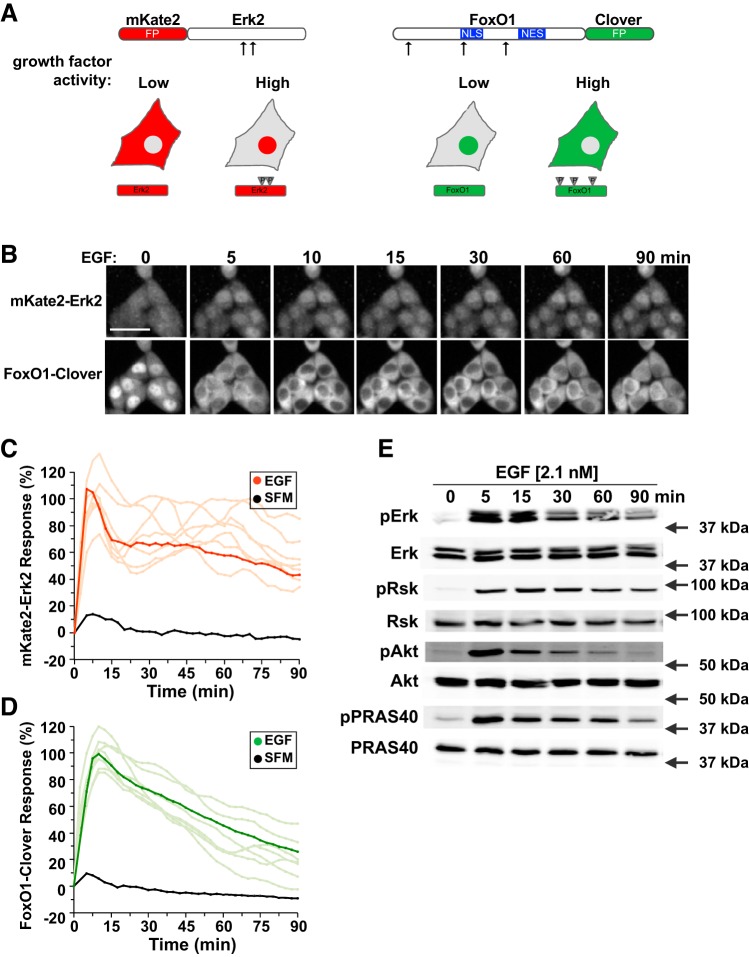
Fig. 1.
Development of sensors for ERK2 and Akt activity. A: top left, map of mKate2-ERK2 reporter molecule showing the positions of ERK2 phosphorylation sites at T185 and Y187; FP, fluorescent protein; bottom, diagram of the subcellular location of the mKate2-ERK2 reporter in cells with low growth factor signaling, where ERK2 is predominantly cytoplasmic, or high activity, where ERK2 is phosphorylated (P) and can be found in the nucleus; top right, map of FoxO1-clover sensor protein showing the positions of Akt phosphorylation sites at T24, S253, and S316. Also indicated are the nuclear localization sequence (NLS) and nuclear export sequence (NES) of FoxO1; bottom, diagram of location of the FoxO1-clover reporter in cells with low growth factor signaling, where FoxO1 is predominantly nuclear, or high activity, where FoxO1 is highly phosphorylated and is primarily cytoplasmic. B: time-lapse images of a representative experiment showing changes in the subcellular location of both reporter molecules in HeLa cells incubated with epidermal growth factor (EGF, 2.1 nM) for the times indicated. Scale bar = 50 μm. C: time course of the relative nuclear intensity of the mKate2-ERK2 reporter in cells incubated in serum-free medium (SFM) and then exposed to SFM or EGF (2.1 nM) for 90 min. Population averages are presented in red (n = ~140 cells/incubation), with individual traces indicated in salmon (n = 10). The nuclear intensity of the reporter in each cell was normalized to its value at the start of imaging during incubation in SFM and scaled to the average peak EGF response. D: time course of the relative translocation response of the FoxO1-clover reporter in the same cells as in C incubated in SFM and then exposed to SFM or EGF (2.1 nM) for 90 min. Population averages are presented (n = ~140 cells/incubation), with individual traces indicated in lime (n = 10). The nuclear intensity of the reporter in each cell was normalized to its value at the start of imaging during incubation in SFM and scaled to the average peak EGF response. E: expression of phosphorylated ERK1/2 (pERK), total ERK, pRsk1/2, total Rsk, pAktS473 (pAkt), total Akt, pPRAS40, and total PRAS40 by immunoblotting using whole cell protein lysates from HeLa cells after exposure to EGF for up to 90 min. Molecular mass markers are indicated to the right of each immunoblot.

