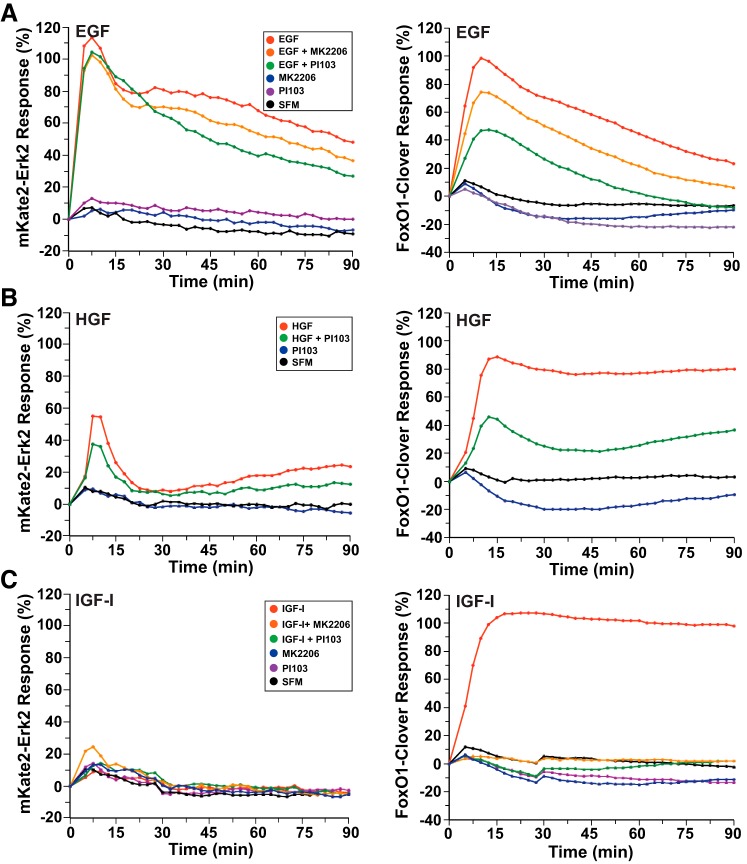
Fig. 4.
Reporter dynamics after exposure of HeLa cells to growth factors and different signaling inhibitors. A: time course of the relative translocation response of the mKate2-ERK2 reporter (left) and the FoxO1-clover reporter (right) in cells incubated in SFM and then exposed to SFM or EGF (2.1 nM) ± different inhibitors for 90 min. B: time course of the relative translocation response of the mKate2-ERK2 reporter (left) and the FoxO1-clover reporter (right) in cells incubated in SFM and then exposed to SFM or HGF (1.7 nM) ± different inhibitors for 90 min. C: time course of the relative translocation response of the mKate2-ERK2 reporter (left) and the FoxO1-clover reporter (right) in cells incubated in SFM and then exposed to SFM or IGF-I (250 pM) ± different inhibitors for 90 min. For A–C, population averages are presented (n = ~140 cells/incubation for each treatment group). For all experiments depicted, the relative responsiveness of each reporter protein in each cell was normalized to values at the start of imaging during incubation in SFM and scaled to the average peak response.

