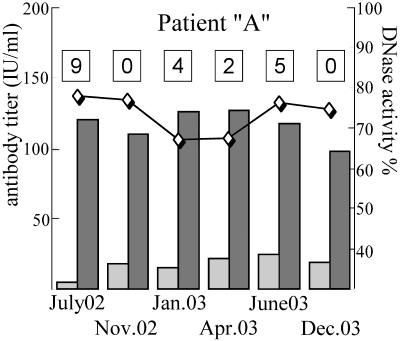
FIG. 5.
Follow-up of an SLE patient. The parameters for six samples from an SLE patient are shown. The dates of blood taking are shown under the bars. Bars show anti-DNA and antinucleosome antibody levels (scale on the left); the line with rhombuses shows the relative DNase activity (scale on the right). The SLEDAI scores for the patient at the time of blood taking are shown in the boxes at the top.

