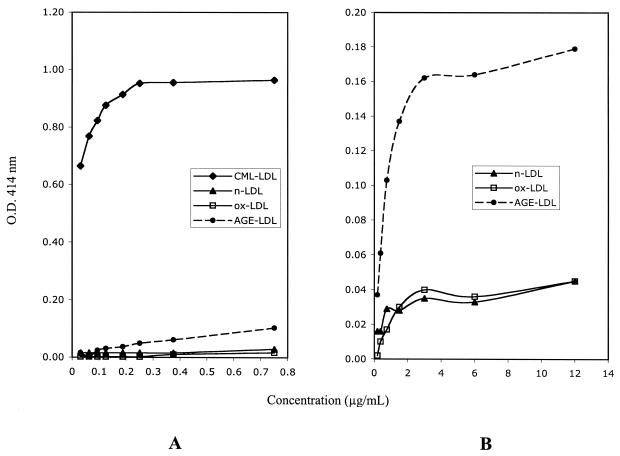
FIG. 2.
Diagrammatic representation of the results of specificity testing for the capture assay for CML-LDL. Panel A illustrates the preferential capture of CM-LDL at low protein concentrations. Panel B illustrates the preferential capture of AGE-LDL relatively to oxLDL and native LDL (nLDL) at high protein concentrations.

