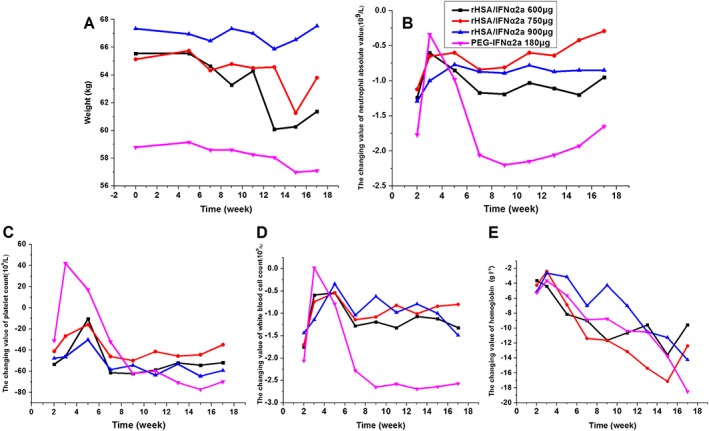
Figure 2.

Reduced value of safety factors at different time points after treatment in each group (all compared with the baseline values). Body weight (A); neutrophil absolute value (B); platelet counts (C); WBC counts (D); haemoglobin absolute value (E)
