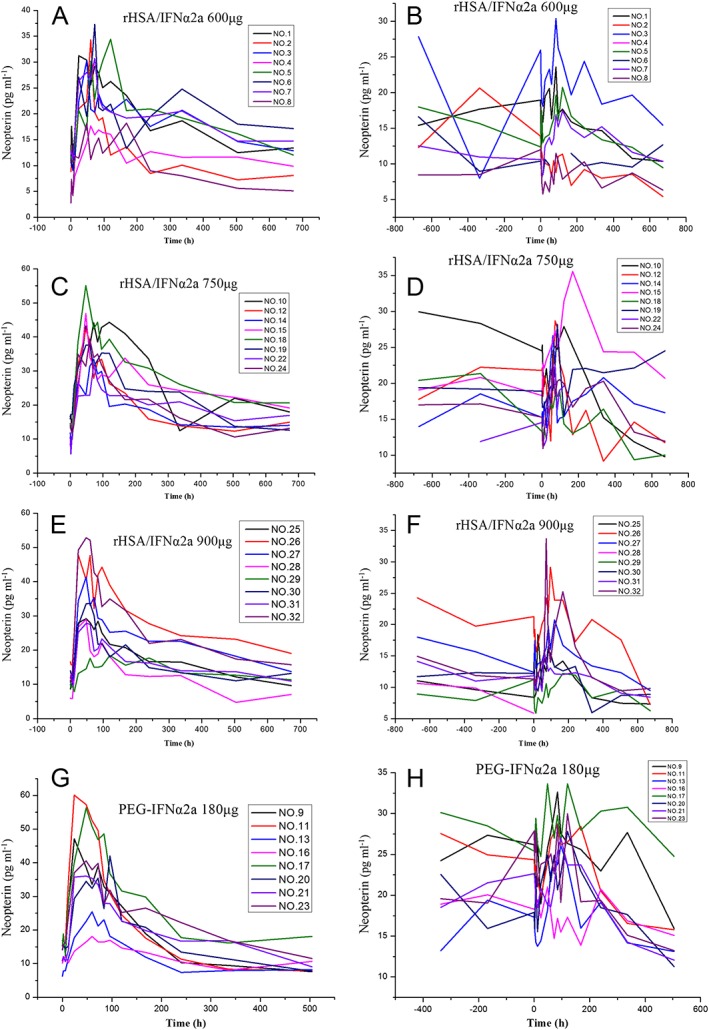
Figure 5.

Neopterin plasma concentration–time profiles in treatment groups following the first and last doses of rHSA/IFNα2a 600, 750 and 900 μg, and PEG‐IFNα2a 180 μg. First dose of rHSA/IFNα2a 600 μg (A); last dose of rHSA/IFNα2a 600 μg (B); first dose of rHSA/IFNα2a 750 μg (C); last dose of rHSA/IFNα2a 750 μg (D); first dose of rHSA/IFNα2a 900 μg (E); last dose of rHSA/IFNα2a 900 μg (F); first dose of PEG‐IFNα2a 180 μg (G); last dose of PEG‐IFNα2a 180 μg (H)
