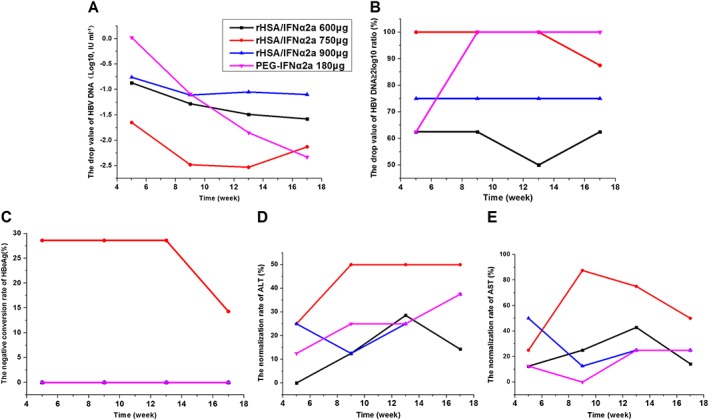
Figure 6.

Reduced levels of HBV markers at different time points after treatment in each group (all compared with the baseline values). HBV DNA (A); rate of HBV DNA reducing value ≥2 log10 (B); HBeAg seroconversion (C); ALT normalization rate (D); AST normalization rate (E)
