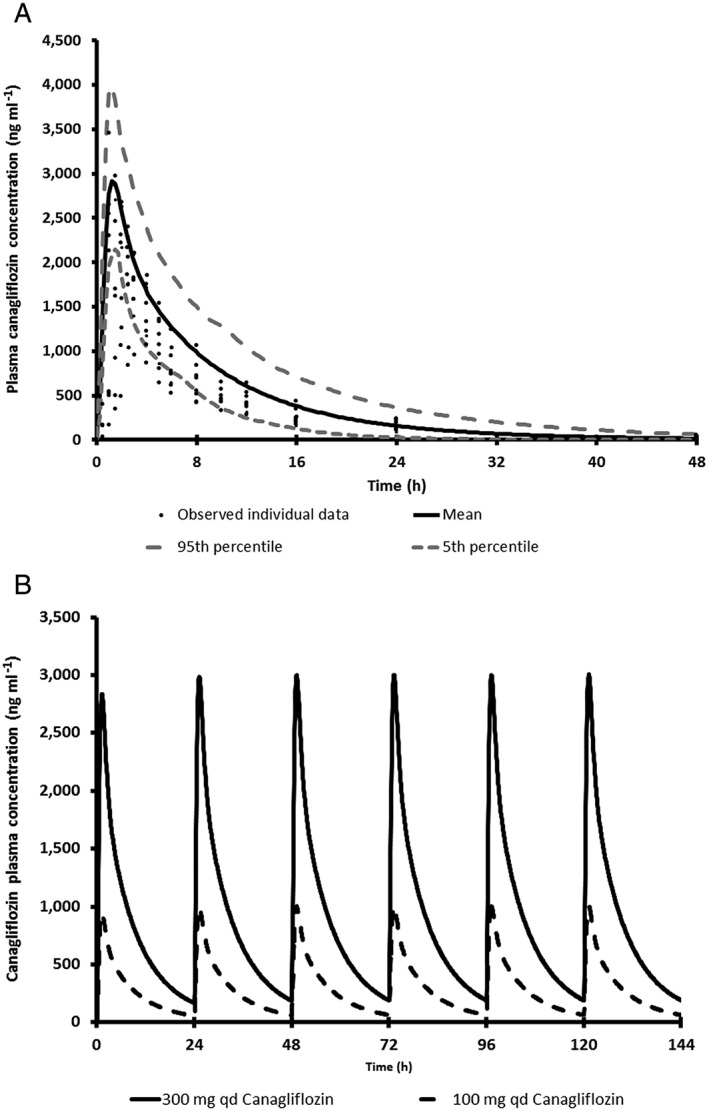
Figure 2.

(A) Overlay plot of simulated mean (and 5th and 95th percentile) and observed canagliflozin pharmacokinetics following a single oral dose of 300 mg to nine healthy subjects. (B) Simulated pharmacokinetic profiles of canagliflozin following repeated oral administration of 100 and 300 mg to healthy subjects for 6 days
