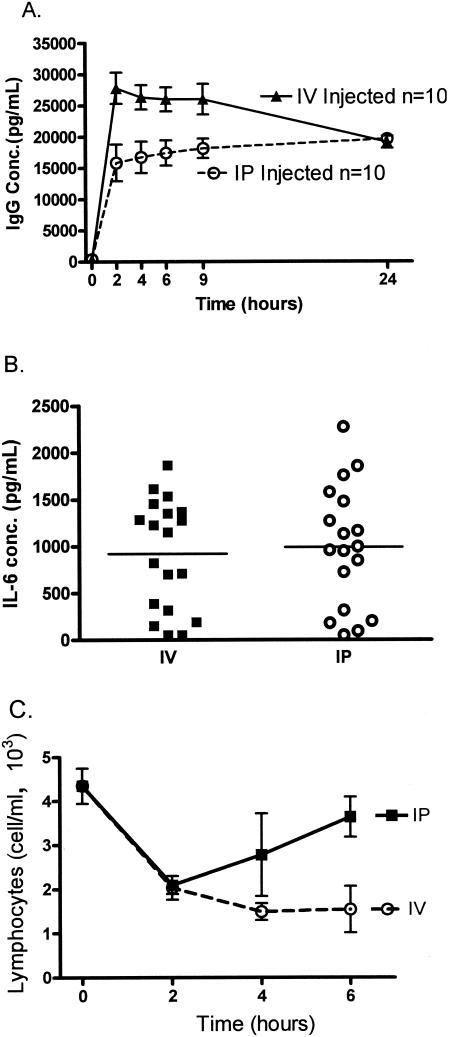
FIG. 3.
Effect of route of administration (i.v. versus i.p.). (A) Rabbit IgG was injected i.v. and i.p. to determine the distribution of a relatively inert, large molecule. Serial blood samples were drawn from the same mouse every 2, 6, 9, and 24 h. Each value is the mean ± SEM (error bar) for 10 mice. Conc., concentration. (B and C) Ten nanograms of endotoxin was diluted in normal saline and injected in a 100-μl volume either i.p. or i.v. Mice were sacrificed at 2, 4, or 6 h after injections. (B) IL-6 production from individual mice at 2 h. (C) Changes in lymphocyte counts over time. Each value is the mean ± SEM (error bar) for eight mice.

