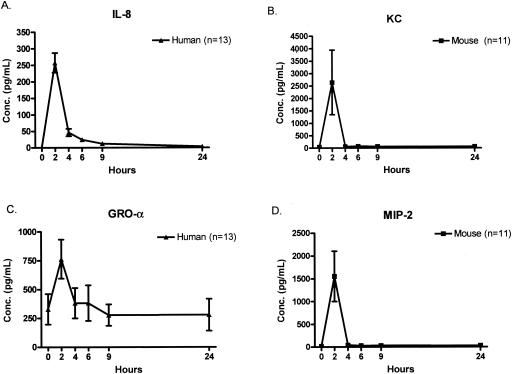
FIG. 8.
Kinetics of CXC chemokine appearance after endotoxin injection. Each of the measured CXC chemokines peaked within 2 h of endotoxin injection. Note that the values of KC and macrophage inflammatory protein 2 in the mouse were significantly higher than IL-8 or growth-related oncogene-α in humans. Each value is the mean ± SEM (error bar) for 13 humans or 11 mice. Conc., concentration.

