Fig. 1.
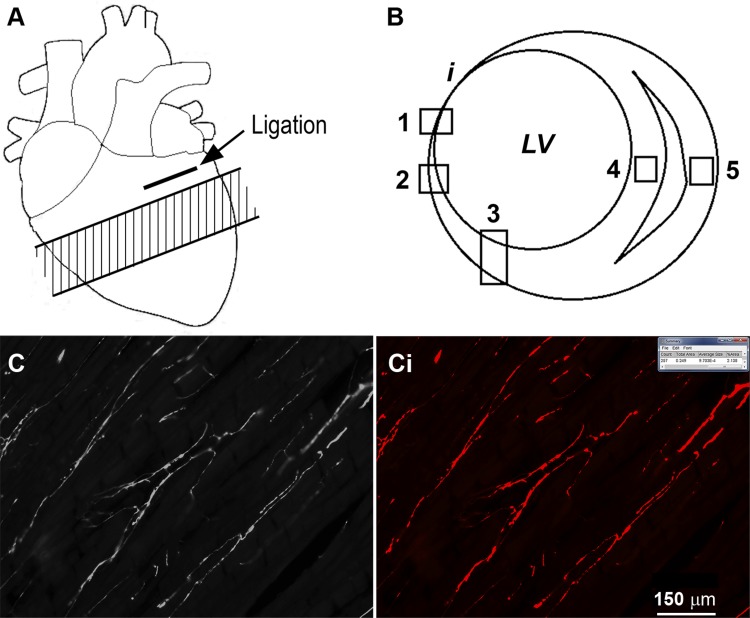
A: approximate area of the cardiac ventricles that was processed for immunohistochemistry analysis apical to the ligation (shaded area). B: areas within each individual section that were imaged. i, infarct; LV, left ventricle; 1, infarct border zone; 2, peri-infarct; 3, left ventricle (LV) free wall; 4, septum; 5, right ventricle free wall. C: sample image of tyrosine hydroxylase immunostaining obtained from the intact myocardium of the LV. Ci: image of the result from threshold analysis using ImageJ software, as performed on the image in C, in which the areas above the set threshold are shown in red. In sham myocardial infarction (MI) animals, the areas of the heart tissue that were imaged were similar to MI animals; however, there was no infarct. Scale bar in Ci applies also to C.

