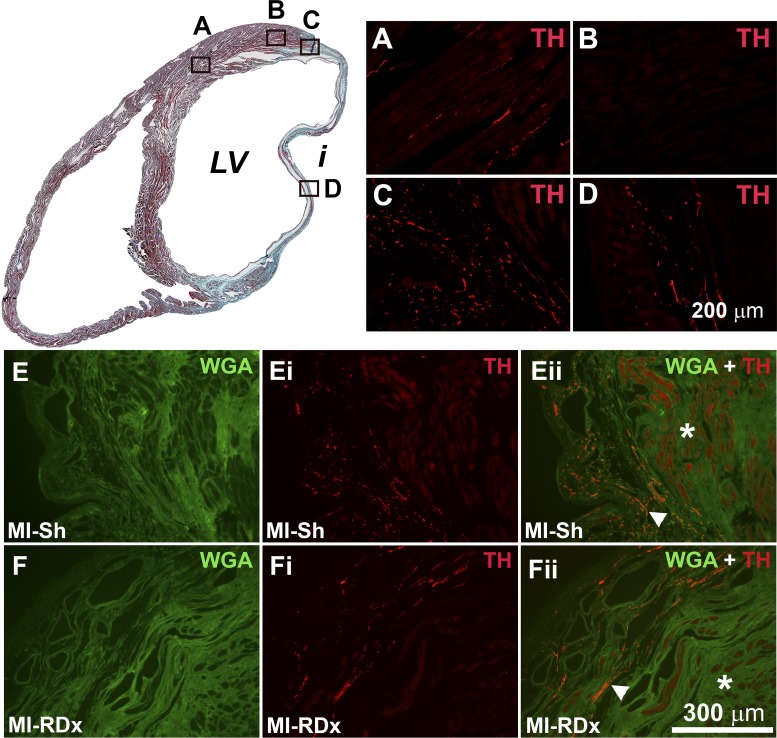
Fig. 3.
Top left: Masson’s trichrome stained (MTS) section from a rat heart that underwent a MI and subsequent sham renal denervation (RDx); viable myocardium is stained red, and infarct (indicated by i) is stained blue. Top right: images of tyrosine hydroxylase (TH) immunostaining (red) in regions as indicated by A, B, C and D shown on the MTS section. A: sympathetic nerve fibers travel parallel to cardiomyocytes in the normal myocardium distant from the infarct. B: sympathetic fibers are minimally expressed in the normal myocardium of the peri-infarct region. C: sympathetic hyperinnervation was observed in the infarcted tissue of the infarct border-zone; D: sympathetic fibers were observed to penetrate deep into the infarct. E and F: wheat germ agglutinin (WGA) immunostaining (green) in the peri-infarct region of MI + sham RDx heart (E) and MI + RDx heart (F). Ei and Fi: TH immunostaining (red) in the peri-infarct region of MI + sham RDx heart (Ei) and MI + RDx heart (Fi). Eii and Fii: WGA and TH double labeling of peri-infarct region of MI + sham RDx heart (Ei) and MI + RDx heart (Fi). *Intact myocardium of the peri-infarct region; arrowhead indicates sympathetic hyperinnervation in the infarcted myocardium of the infarct border-zone. Scale bar in D applies also to A, B, and C. Scale bar in Fii applies to E, Ei, Eii, F and Fi. LV indicates left ventricle.

