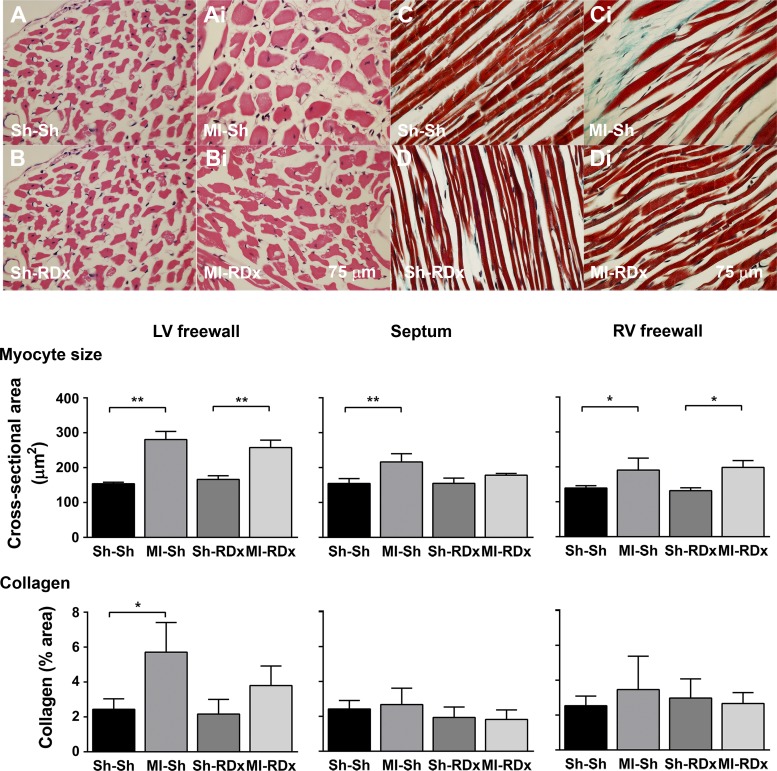
Fig. 5.
Cardiomyocyte size and collagen content in the left ventricle (LV) in relation to treatment group. Hematoxylin and eosin (H&E)-stained cardiomyocytes (top left) and MTS-stained LV tissue (top right) for animals that underwent either sham MI or MI and sham RDx or RDx. Sample images for H&E staining for sham MI + sham RDx (Sh-Sh: A), MI + sham RDx (MI-Sh: Ai) sham MI + RDx (Sh-RDx: B) and MI + RDx (MI-RDx: Bi). Example images for MTS staining for sham MI + sham RDx (Sh-Sh: C), MI + sham RDx (MI-Sh: Ci) sham MI + RDx (Sh-RDx: D) and MI + RDx (MI-RDx: Di). Mean cardiomyocyte size and collagen content, as a percentage (%) of total area, in the free wall of the LV, septum, and right ventricle across experimental groups are shown in bar graphs. *Significant difference between groups, P = 0.01 < 0.05. **Significant difference between groups, P < 0.01. Values are expressed as means ± SE (n = 4–6). Scale bar in Bi applies also to A, Ai, and B, and scale bar in Di applies also to C, Ci, and D.

