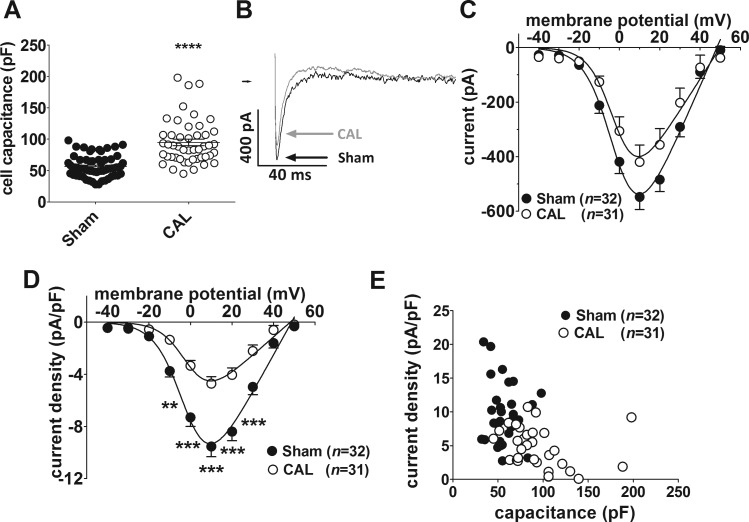
Fig. 2.
A: whole cell capacitances for Sham (n = 63/12) and CAL (n = 47/10) myocytes. ****P < 0.0001, Mann-Whitney test. B: representative whole cell L-type Ca2+ current (ICaL) traces at +10 mV. Sham, black; CAL, gray. C: mean ICaL-voltage relations for Sham [filled circles, (n no. of cells/N no. of animals) = 32/12] and CAL (open circles, n/N = 31/10) myocytes. D: mean ICaL density-voltage relations for Sham (filled circles) and CAL (open circles) myocytes. Same data as shown in C. **P < 0.01, ***P < 0.001, 2-way repeated-measures ANOVA with Bonferroni posttest. Solid lines in C and D represent fits to Eq. 1. E: correlation between ICaL density at +10 mV in Sham (filled circles, n/N = 32/12) and CAL (open circles, n = 31/10) myocytes. Atrial ICaL density for the two groups of cells combined was significantly correlated (r = −0.4772, n/N = 63/22, P < 0.0001).

