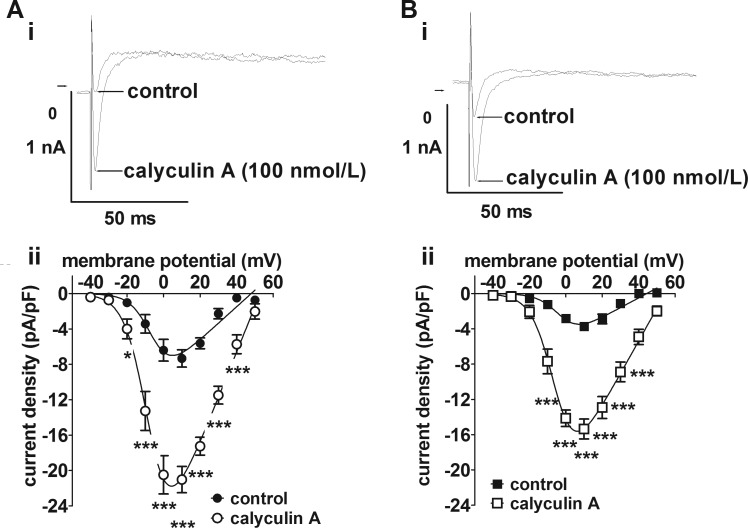
Fig. 4.
Atrial L-type Ca2+ currents following phosphatase inhibition. A, i: representative current traces recorded at +10 mV from a Sham myocyte before and after superfusion with 100 nmol/l calyculin A. A, ii: ICaL density-voltage relations from Sham myocytes (n/N = 6/3) in control (filled circles) and in the presence of 100 nmol/l calyculin A (open circles). *P < 0.05, ***P < 0.001, 2-way repeated-measures ANOVA and Bonferroni posttest. B, i: representative current traces recorded at +10 mV from a CAL myocyte before and after superfusion with 100 nmol/l calyculin A. B, ii: ICaL density-voltage relations from CAL myocytes (n/N = 9/3) in control (filled squares) and in the presence of 100 nmol/l calyculin A (open squares). ***P < 0.001, 2-way ANOVA and Bonferroni posttest.

