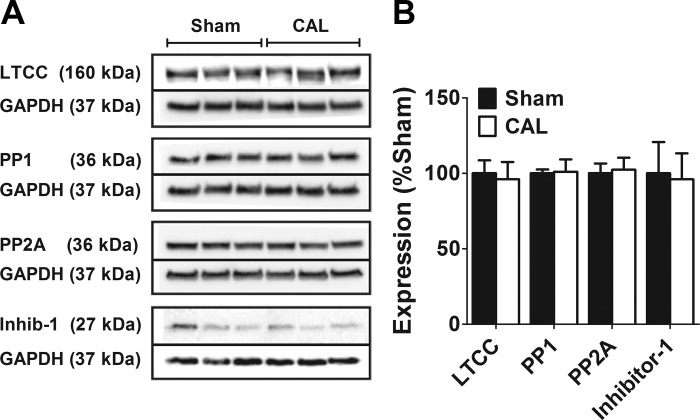
Fig. 7.
Left atrial expression of the Cav1.2 LTCC α1c subunit and various protein phosphatases in heart failure. A: representative Western blots of LTCC, protein phosphatases, and GAPDH from Sham and CAL rats. For each protein, the bands are taken from the same gel and have not been manipulated for contrast, color-balance, brightness, or background. Solid lines demarcate the bands for the target protein and for the GAPDH loading control, which were taken from the same gel. For each protein, the molecular weights of the bands are indicated. B: mean band intensity expressed relative to Sham as 100%. Data are means ± SE from 3 Sham and 3 CAL hearts.

