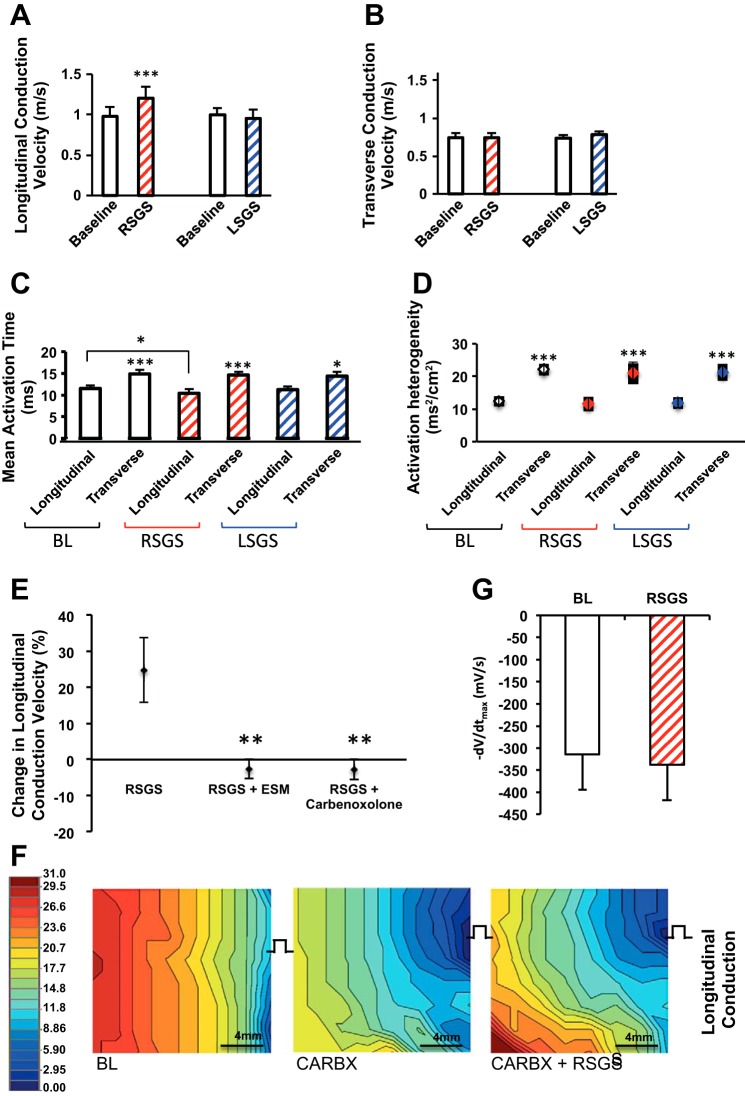
Fig. 3.
Sympathoexcitation and conduction velocity in normal hearts. A–D: graphs showing the impact of RSGS and LSGS on longitudinal and transverse conduction velocity (CV), mean activation time, and activation heterogeneity (n = 12, *P < 0.05, ***P < 0.001, Wilcoxon signed rank test). E: graphs showing the impact of esmolol (ESM) and carbenoxolone on change in CV during RSGS (n = 3, **P < 0.01, Wilcoxon signed rank test). F: representative activation maps depicting the effect of carbenoxolone (CARBX) ± RSGS on longitudinal propagation. G: maximal negative slope of activation waveform (−dV/dtmax) of electrograms during pacing at baseline and during RSGS (n = 5, **P = 0.2, Wilcoxon signed rank test).

