Fig. 7.
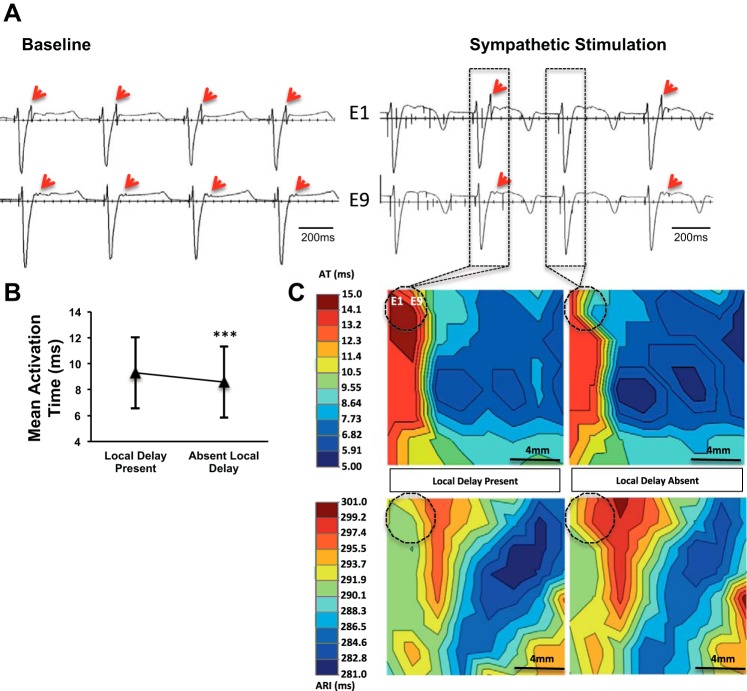
SGS can alter propagation in putative ventricular tachycardia circuits. A: electrograms recorded from the peri-infarct region of a subject, depicting a late potential (LP, red arrows) at baseline and during left sympathetic stimulation. B: mean activation time in the region mapped with and without local delay (i.e., LP) (***P < 0.001, Student’s t-test). C: propagation (top row) and activation recovery interval (bottom row) maps with and without local delay (LP). Dashed circle indicated the location of electrodes 1 and 9 (E1 and E9, respectively) recording the LP.

