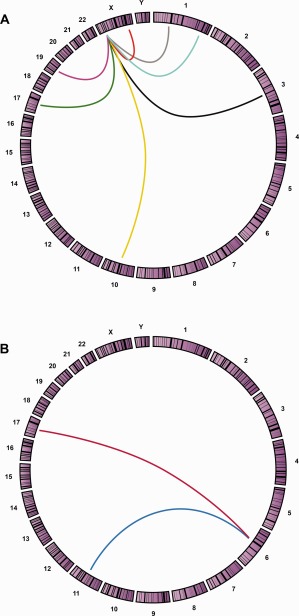
Figure 4.

Genomic translocation relationships presented by Circos plot. Circos applies a circular ideogram displaying relationships between genomic intervals. The Circos plot is a ring composed of all chromosomes in proportionate size clockwise from 1 to Y. This graphic representation is used to visualize chromosomal translocations associated with a clinical entity. A specific translocation is shown with a line connecting the two chromosome partner loci involved in each translocation. The chromosomal translocations that may be involved in Xp11 translocation renal cell carcinomas are shown in A, including inv(X)(p11.2;q12) [NonO‐TFE3] (Red), t(X;1)(p11.2;p34) [PSF‐TEF3] (Gray), t(X;1)(p11.2;q21) [PRCC‐TFE3] (Blue), t(X;3)(p11.2;q23) [unknown‐TFE3] (Black), t(X;10)(p11.2;q23) [unknown‐TFE3] (Yellow), t(X;17)(p11.2;q23) [CLTC‐TFE3] (Magenta), t(X;17)(p11.2;q25) [ASPL‐TFE3] (Green), t(X;19)(p11.2;q13.1) [unknown‐TFE3] (Purple). Translocations involved in TFEB translocation renal cell carcinoma are shown in B, t(6;11)(p21;q13) [MALAT1‐TFEB] (Blue), t(6;17)(p21;q25) [ASPSCR1‐TFEB] (Red).
