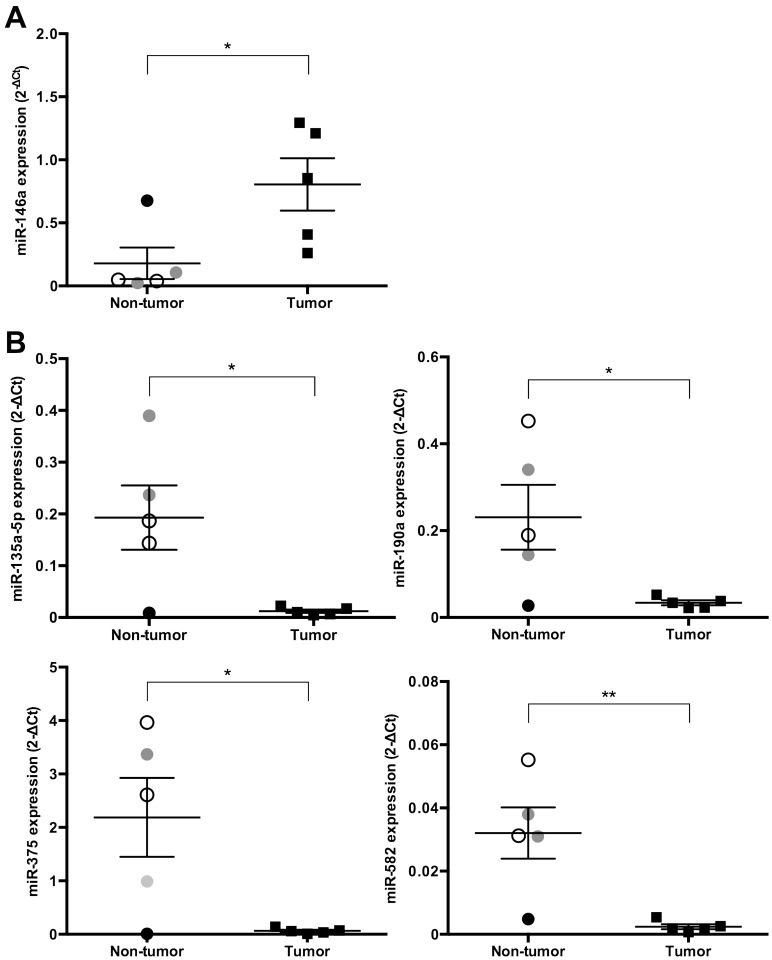
Fig. 3.
Scatter plots of miRs up-regulated or down-regulated at the same level between the dog with prostatitis and the tumor group. The expression levels (2-ΔCt) of various miRs were calculated using the same method as detailed in Figs. 1 and 2. (A) The expression level of one miR (miR-146a) was up-regulated (more than 4-fold) in prostatic tissue from cPCa compared with non-tumor dogs, but miR-146a was up-regulated to the same level in the dog with prostatitis and in the tumor group. (B) The expression levels of four miRs (miR-135a-5p, 190a, 375 and 582) were down-regulated (more than 4-fold) in prostatic tissue from cPCa compared with non-tumor dogs, but those of miR-135a-5p, 190a, 375 and 582 were down-regulated to the same level as in the tumor group. Open circles, gray circles, closed circles and closed squares indicate normal, BPH, prostatitis and cPCa tissue, respectively. Results are expressed as mean ± SE. *P<0.05, **P<0.01 (unpaired t-test).

