Figure 3.
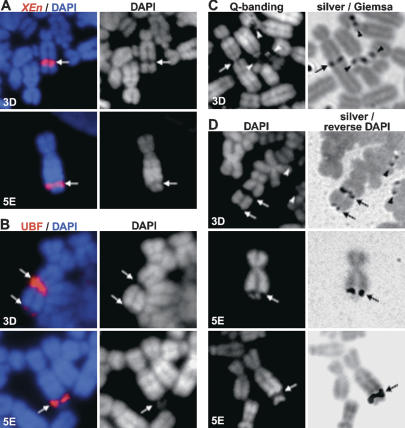
XEn arrays display characteristics of NORs. (A) XEn arrays form secondary constrictions. Metaphase spreads prepared from clones 3D and 5E were hybridized with a spectrum red-labeled probe to visualize XEn arrays. Merges of probe and DAPI staining are shown in left panels. Grayscale images of DAPI staining are shown on the right. XEn arrays and secondary constrictions are denoted by arrows. (B) UBF remains associated with XEn arrays during metaphase. Chromosomes were stained with rhodamine-conjugated affinity-purified α-UBF antibodies and mounted in DAPI/Antifade (left). Grayscale images of DAPI staining are shown on the right. XEn arrays and secondary constrictions are denoted by arrows. (C) XEn arrays are positive in silver staining. (Left) Chromosomes prepared from clone 3D were Q-banded, and images were captured. (Right) Subsequently, chromosomes were stained with silver and counterstained with Giemsa, and images of the same fields were captured. Pseudo-NORs are indicated by arrows, NORs by arrowheads. (D) XEn arrays are positive in silver staining. Chromosomes prepared from clones 3D and 5E were stained with DAPI (left) and silver. The right panels show a merge of silver and reverse DAPI images. Note the presence of an additional UBF and silver-positive smaller XEn array at the telomere of the rearranged chromosome 10 in clone 3D. Pseudo-NORs are indicated by arrows and NORs by arrowheads.

