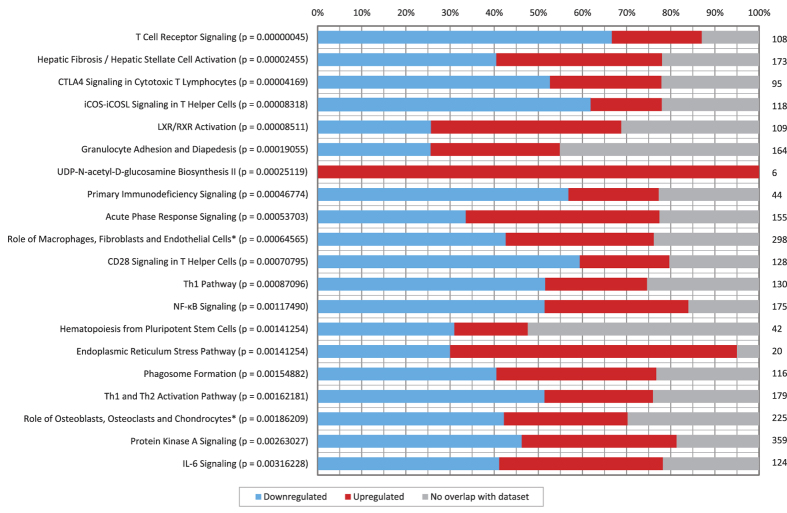
Figure 1. Pathway Analysis of Differentially Expressed Genes of the ICLN in Multibacillary Paratuberculosis.
The top twenty canonical pathways enriched for differentially expressed genes identified in the M versus C dataset are displayed along the y-axis, the significance values (shown in brackets) were calculated by Fisher’s exact test right-tailed in IPA. The percentage of differentially expressed genes down-regulated and up-regulated within each canonical pathway are shown on the x-axis. The total number of genes in a pathway is displayed to the right of each of the stacked bars. (* in Rheumatoid Arthritis).

