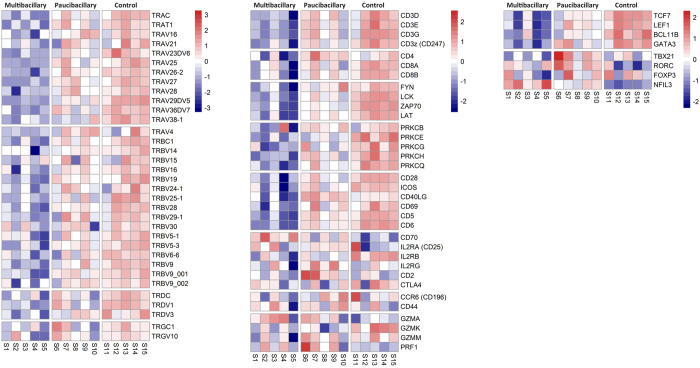
Figure 2. Heatmap of paratuberculosis associated changes to the T cell transcriptome.
Heatmap profile of identified TCR/CD3 and other T cell associated genes expressed in the ICLN of diseased and control sheep. The colour key indicates the direction of changes, with red depicting genes up-regulated and blue showing genes down-regulated. The colour represents log2 counts per million for each sample, centred and scaled for each row.

