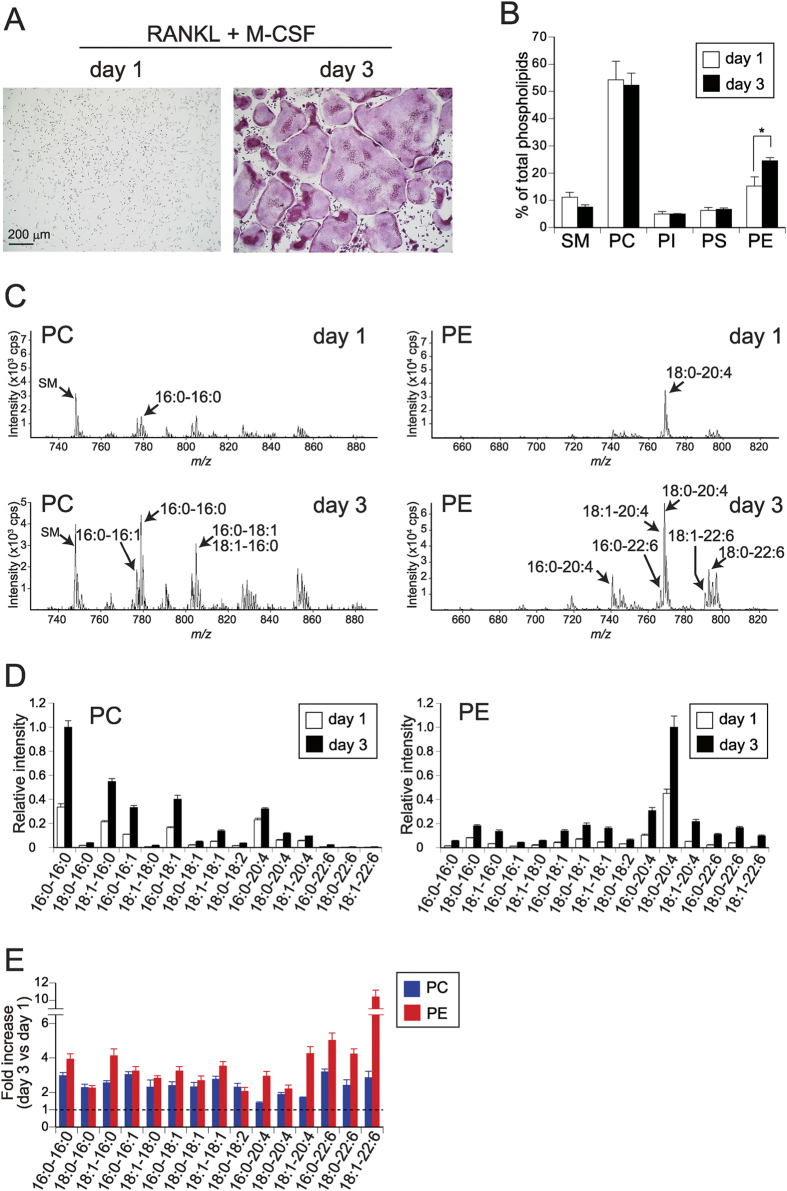
Figure 1. Increase of PE content during osteoclastogenesis.
(A) Osteoclast differentiation in vitro. Bone marrow cells were cultured with M-CSF and TGF-β for 3 days (osteoclast precursors) and then for an additional 1 day (immature osteoclasts) or 3 days (mature osteoclasts) with RANKL and M-CSF. The cells were stained for TRAP. (B) Phospholipid compositions of immature and mature osteoclasts. Osteoclast precursors (6 × 10⁵ cells/well in 6-well plates) were cultured for 1 or 3 days with RANKL and M-CSF, and lipids extracted from these cells were separated by two-dimensional thin layer chromatography and quantified. The percentages of individual phospholipid species relative to total phospholipids are shown (n = 6). (C) Representative MS profiles of PC and PE species in immature and mature osteoclasts. Phospholipids extracted from the cells cultured in a 96-well plate were applied to the MS analysis. Peaks for major molecular species are indicated. (D) Quantitative results of MS analysis (n = 4). (E) Fold increase (day 3 versus day 1) of the individual phospholipid species quantified in (D) (n = 4). A dashed line (fold increase of 1) indicates that the amounts before and after differentiation are equivalent. Each value is the mean ± SE.

