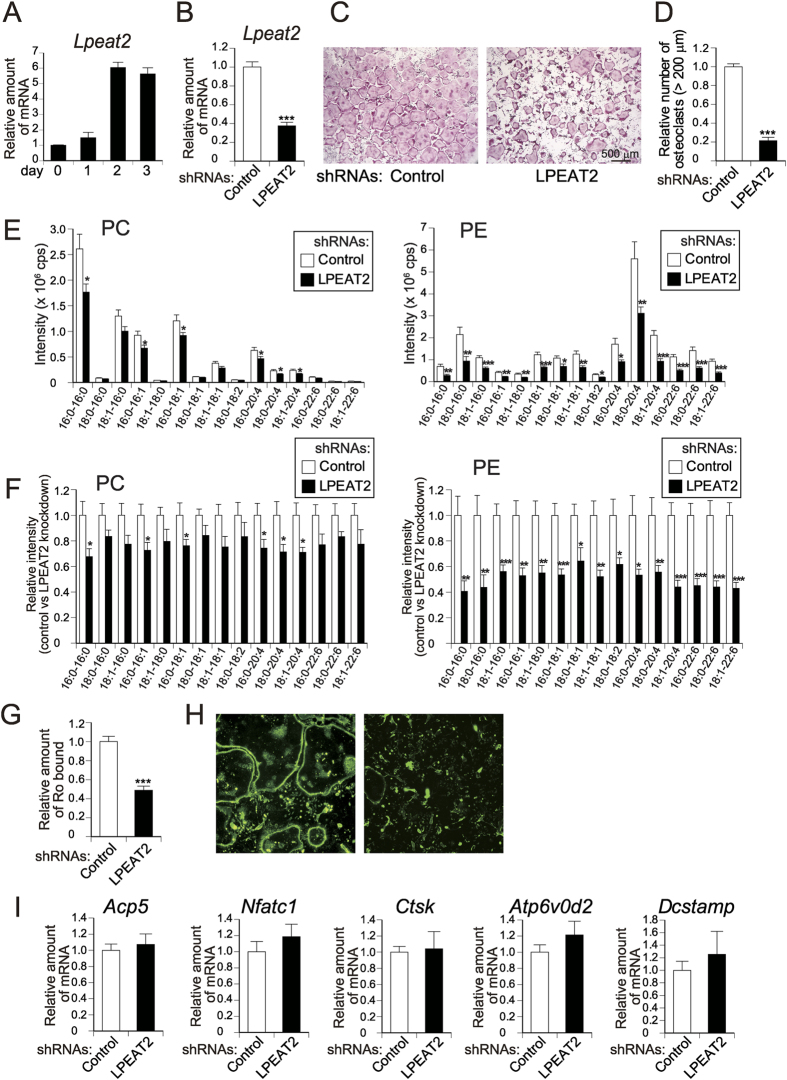
Figure 6. Role of LPEAT2 in PE biosynthesis and osteoclast formation.
(A) Gene expression of Lpeat2 during osteoclastogenesis. Osteoclast precursors (day 0) were cultured with M-CSF and RANKL for 1 to 3 days and subjected to quantitative PCR analysis (n = 3). (B–I) shRNA-mediated knockdown of LPEAT2 in osteoclasts. Osteoclast precursors were infected with retrovirus expressing shRNA for LPEAT2 or control and then cultured with M-CSF and RANKL for 5 days. (B) Efficiency of shRNA-mediated knockdown was validated by quantitative PCR (n = 8). The cells infected with the shRNA-bearing retroviruses were stained for TRAP (C) and TRAP-positive multinucleated osteoclasts were counted (n = 8) (D). (E) The shRNA retrovirus-infected cells were subjected to MS analysis. Individual PC and PE species are quantified (n = 8). (F) Relative amounts (control versus LPEAT2 knockdown, with control as 1) of the individual phospholipid species quantified in (E) (n = 8). (G) The cells infected with the shRNA-bearing retrovirus were treated with SA-Bio-Ro and immunostained, and then the fluorescence intensity was quantified (n = 8). Representative fluorescence images are shown in (H). (I) Expressions of osteoclast-related genes in the shRNA retrovirus-infected cells (n = 12). Each value is the mean ± SE.

