Figure 6.
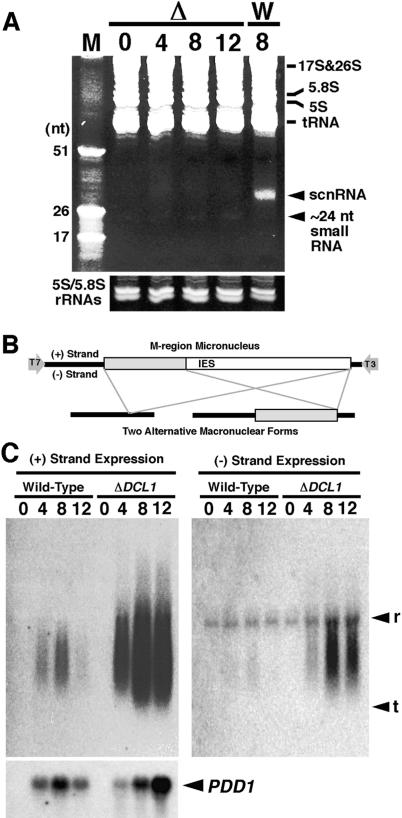
Expression of scnRNA and nongenic Mic transcripts. (A) Total RNA was extracted from mating DCL1 knockout RI cells (Δ) at 0, 4, 8, and 12 h post-mixing or from wild-type cells (W) at 8 h post-mixing. RNA from 5 × 10⁴ cells was analyzed in 12% acrylamide-urea gel and stained with ethidium bromide. In vitro-transcribed 17, 26, and 51 nt RNAs were used as markers (M). The gel was partially destained, and the amounts of 5S and 5.8S rRNAs are shown as loading controls. (B) Schematic drawing of the Mic M-region sequence (top) and its two alternatively processed Mac forms (bottom). (Open box) IES; (gray box) IES eliminated only in the long-deletion form; (horizontal bars) Mac-destined sequences (MDSs). Promoters for T3 and T7 RNA polymerases were added at the 5′ and 3′ ends of Mic M-region sequence, respectively. (C) Northern blot made with total RNA extracted from equal numbers of wild-type and DCL1 knockout RI cells at 0, 4, 8, and 12 h post-mixing and hybridized with probes complementary to (+) strand (left) and (–) strand (right) of the Mic M-region made by in vitro transcription with T3 and T7 RNA polymerase, respectively. Positions for 17S + 28S rRNAs and tRNAs are marked with r and t, respectively. The blot used for (+) strand probe was reprobed with a PDD1 probe as a marker for conjugation (left, bottom). Increased expression of PDD1 in DCL1 knockout cells at late stages of conjugation (12 h post-mixing) probably reflected arrested conjugation in the late stages.

