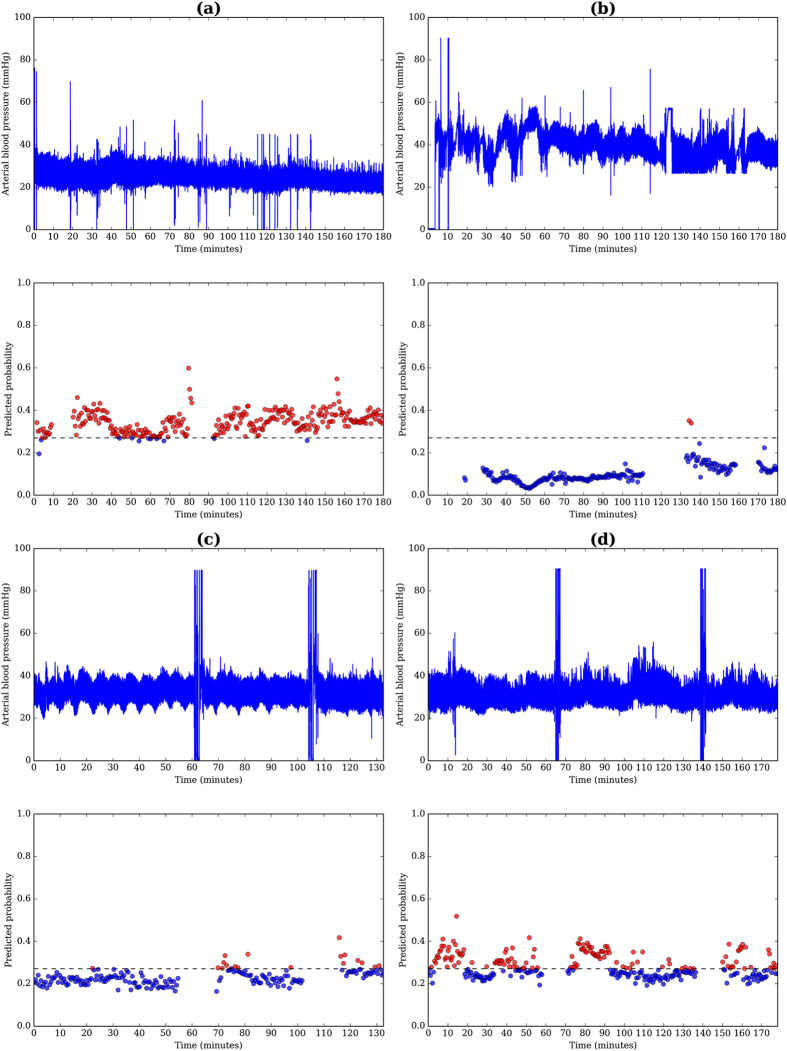
Figure 4.
Arterial blood pressure data and the predicted probability for IVH using the highest scoring model, mean DBP and PI α2 for correct classification of (a) IVH and (b) non-IVH, as well as incorrect classification of (c) IVH and (d) non-IVH. The threshold for classifying IVH, designated by the dashed line was defined at 90% specificity and 85% sensitivity. Red and blue markers represent windows that exceeded and did not exceed the threshold, respectively.

