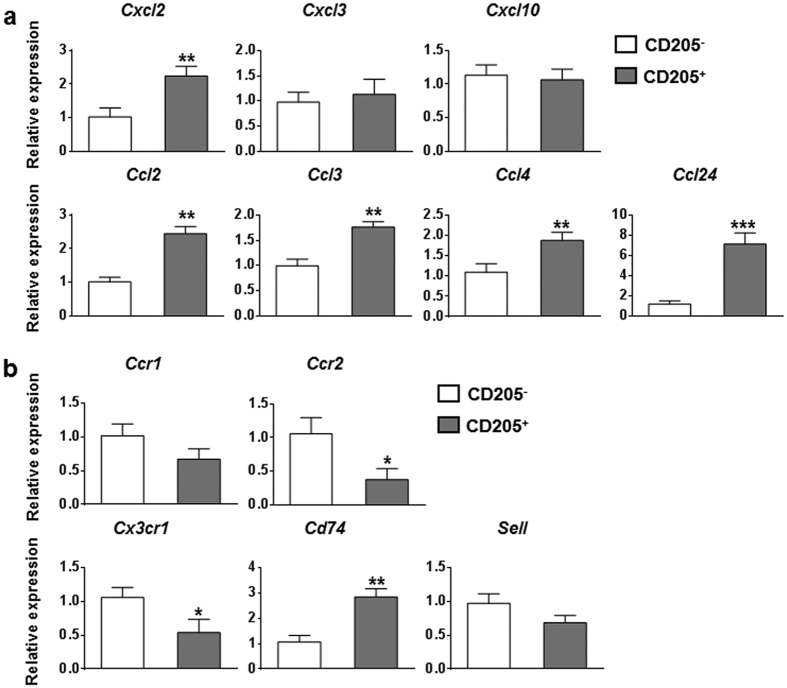
Figure 4. Expression of chemokine and chemokine receptor genes in hepatic CD205+ and CD205− macrophages.
Quantitative PCR analysis of relative mRNA levels of chemokine genes (a) and chemokine receptor genes (b) in hepatic CD205+ and CD205− macrophages derived from HBs-Tg mice. Values are expressed as fold amplification over CD205− macrophages following normalization with Actb. Data represent mean ± SD from three independent experiments. *p < 0.05, **p < 0.01, ***p < 0.001, two-tailed unpaired Student’s t-test.

