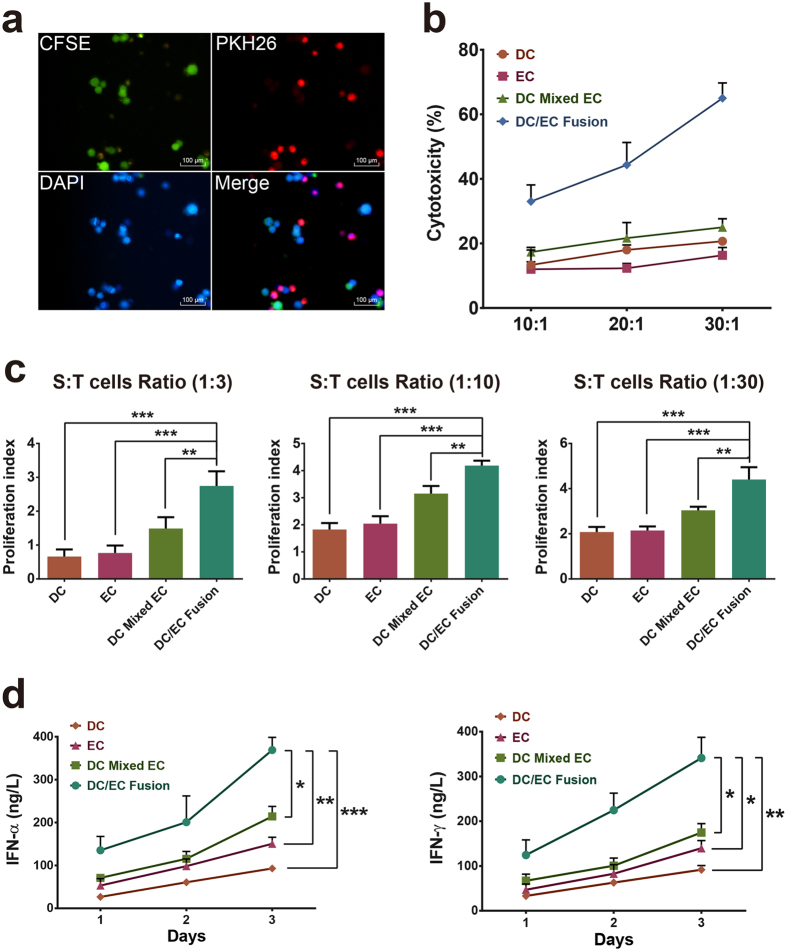
Figure 2. Phenotype of DC/EC and stimulation of antitumor CTL cells by DC/EC.
(a) ECs were stained with CFSE (Green), DCs were stained with PKH26 (Red) and the nuclear were stained with DAPI (Blue). Scale bars = 100 μm. (b) Cultured with DC only, EC only, DC mixed with EC, or DC/EC fusion, then the stimulated T cells were incubated with PKH-26-labled target ECs at the indicated effector-to-target cell (10:1, 20:1, 30:1), and then detected for lysis. (c) The proliferation of T cells was measured after cultured with DC only, EC only, DC mixed with EC, or DC/EC fusion. (d) The IFN-α and IFN-γ production of T cells were analyzed by ELISA. *P < 0.05, **P < 0.01, ***P < 0.001.

