
Figure 6.
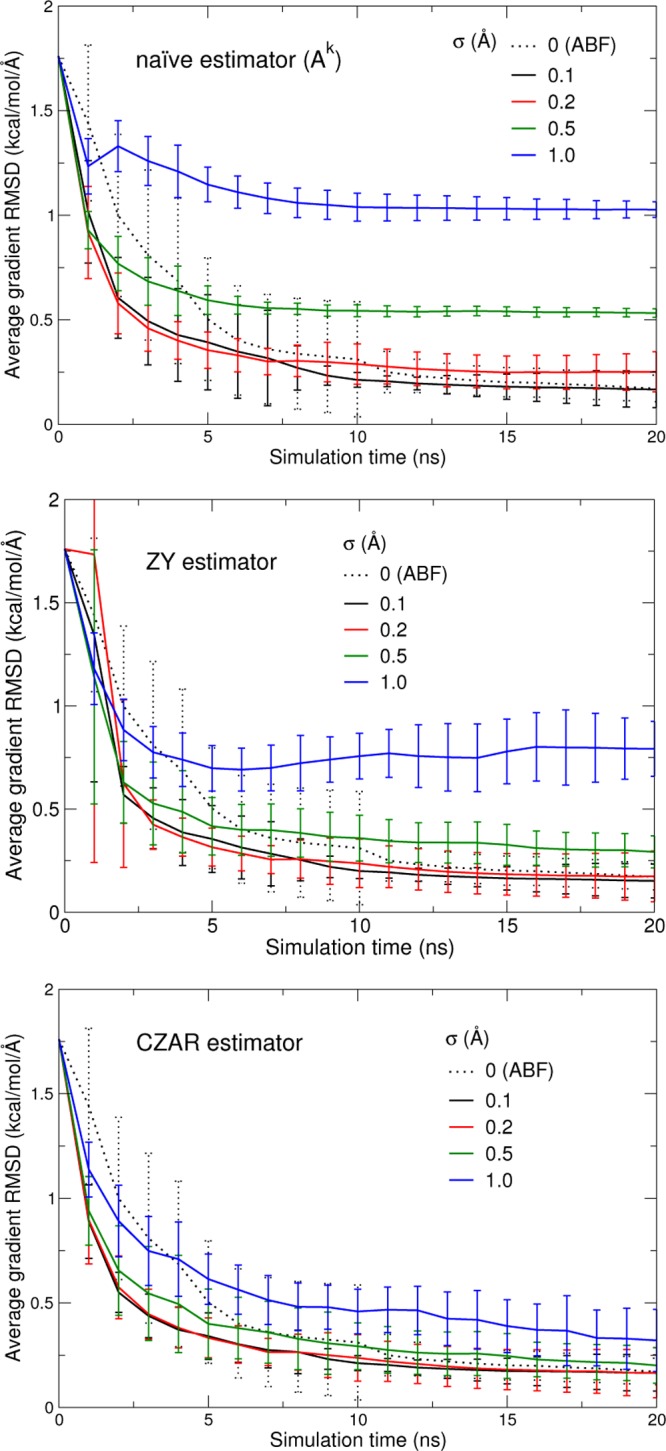
Convergence of the naive (top), Zheng/Yang (middle), and CZAR (bottom) free energy estimators, as a function of the coupling parameter σ. The graphs show the RMS deviation from the converged, true free energy gradient of each free energy gradient estimator as a function of sampling time, averaged over 20 20 ns trajectories (error bars indicate standard deviation over the 20-fold average). The dotted line is from a set of standard (nonextended system) ABF simulations.