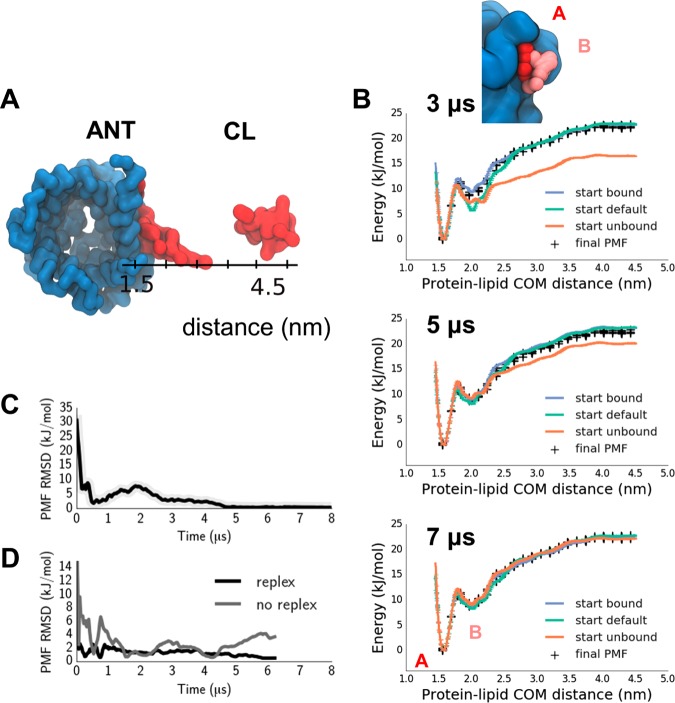
Figure 2.
Cardiolipin binding to ANT, providing an example of calculating a PMF for a lipid interacting with a specific binding site on an integral membrane protein. (A) Representative structures of the closest (protein lipid COM distance =1.5 nm) and furthest (4.5 nm) replicas in the cardiolipin-ANT binding simulations. (B) PMFs starting from 3 different initial configurations (default in cyan, unbound in orange, bound in blue; black crosses indicate the final PMF for comparison; see Figure 1 for definitions), computed after 3, 5, and 7 μs of the simulation (within each case the first half of the simulation discarded as equilibration). Thus, the final PMF contains data pooled from 2 replica exchange simulations, corresponding to the starting bound and unbound initial conditions. (C) Root mean square difference between the two PMFs started from “all bound” and “all unbound” configurations as a function of time. (D) PMF RMSD to the final PMF of simulations started from the default initial condition and either allowing for replica exchange (labeled replex) or without exchanges (labeled no replex).

