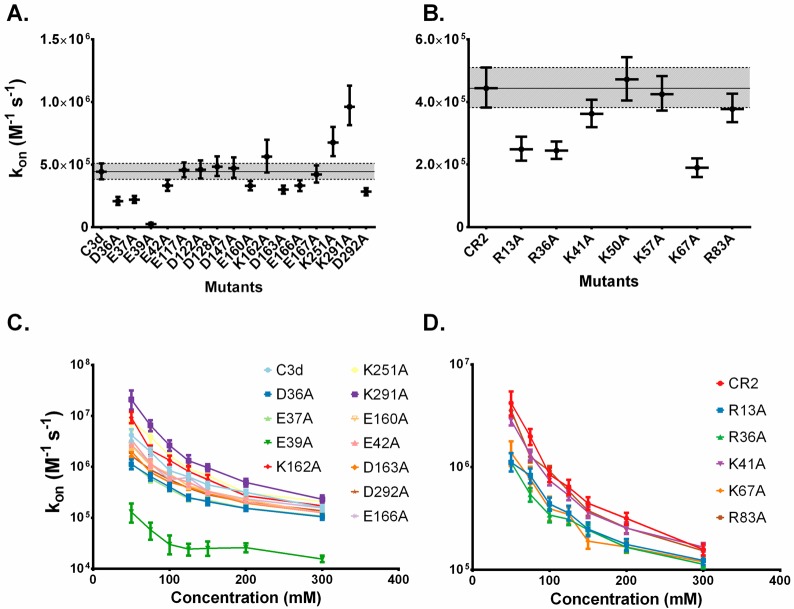
Figure 4.
Effects of mutagenesis on association rate constant and ionic strength dependence. (A, B) The mean association rate at 150 mM ionic strength is plotted for each mutant for C3d and CR2 with 95% confidence intervals represented as error bars. The shaded region represents the upper and lower bound threshold of the association rate constant values of the parent (C3d or CR2). Computational mutations were performed based on previous experimentally generated mutants.35,40,41 (C, D) Ionic strength dependence of selected mutants demonstrating significant deviations from the wild type association rate constant. The mutant notation denotes the residue number surrounded by the replaced residue on the left and the replacing residue on the right.

