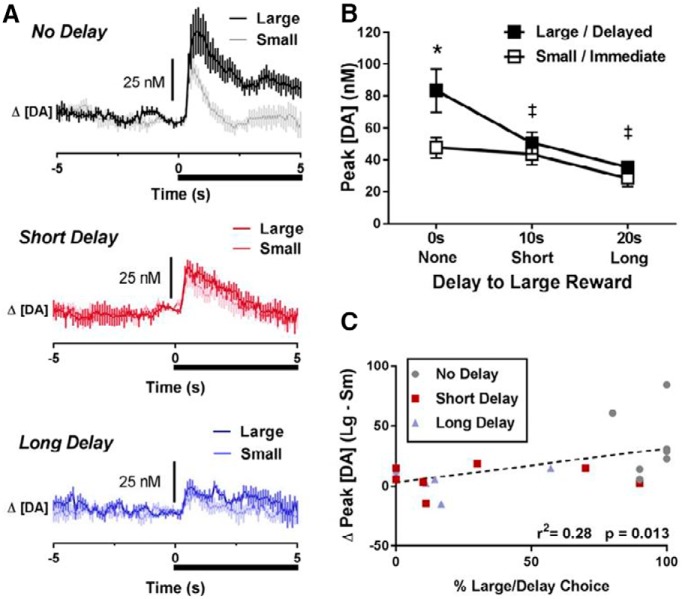
Figure 2.
DA release dynamics relative to the cue for rats with a history of water/saline self-administration (controls). A, Change in [DA] as a function of time for each cue during each delay block. Cue onset and duration is indicated by the black bar below each trace. B, Changes in peak cue DA as a function of magnitude and delay. Peak DA was significantly greater following the large reward cue than the small reward cue at the 0-s delay. However, peak DA to the large reward cue significantly decreased at the 10- and 20-s delays. C, The relationship between relative peak cue DA (peak cue DA for the large reward cue minus peak cue DA for the small reward cue) and subsequent choice behavior during free choice trials. Higher relative peak cue DA for the large reward predicted greater choice of the large reward. *p < 0.05 comparing large reward cue to smaller reward cue, ‡p < 0.05 comparing large reward cue at 0 s to large reward cue at 10 and 20 s.

