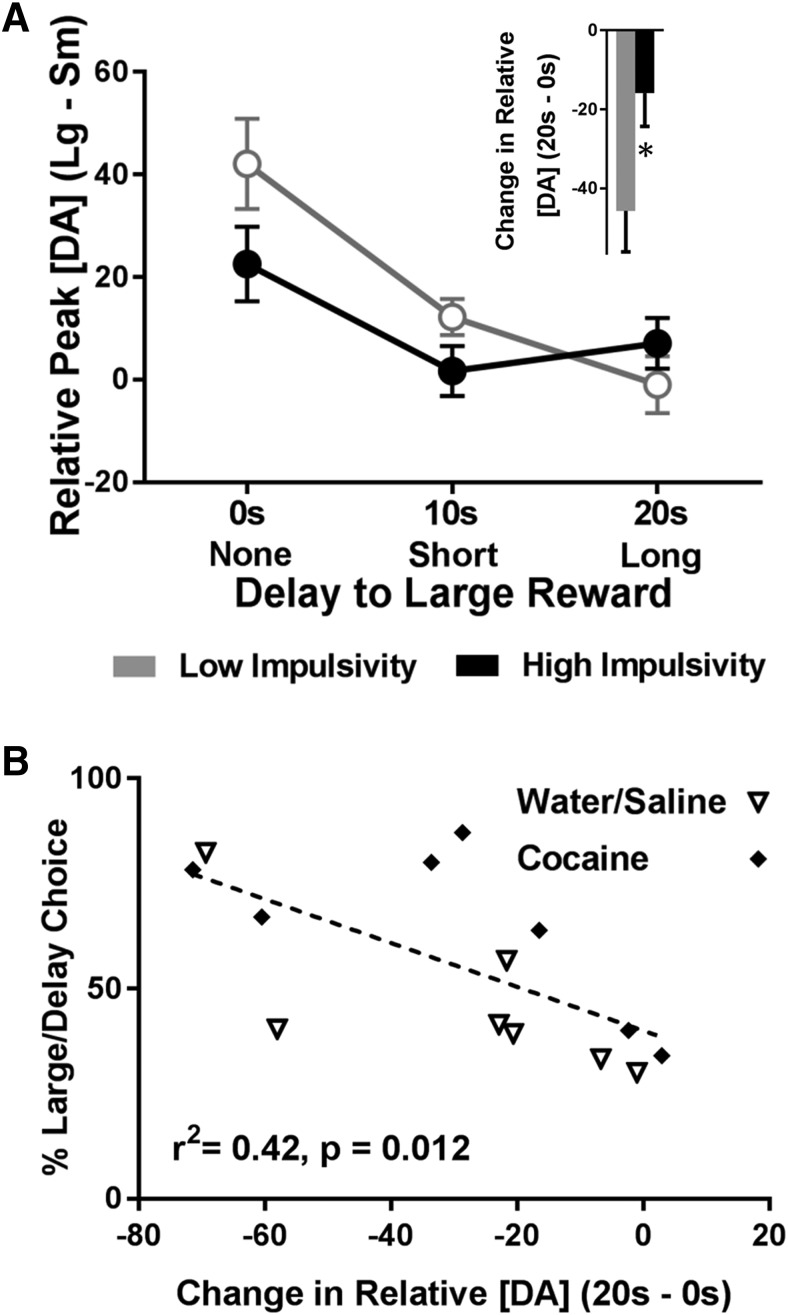
Figure 5.
Differences in the change in relative peak cue DA as a function of impulsivity. A, Relative peak cue DA for the large reward cue (peak cue DA for the large reward cue minus peak cue DA for the small reward cue) decreased as a function of delay, but the decrease was weaker in impulsive rats. The raw data from which these difference scores were derived are: Low impulsivity, Large cue, 0 s: 103.52 ± 8.22 nM; small cue, 0 s: 61.42 ± 7.92 nM; large cue, 10 s: 57.57 ± 4.58 nM; small cue, 10 s: 45.36 ± 7.16 nM; large cue, 20 s: 31.35 ± 3.70 nM; small cue, 20 s: 32.31 ± 7.27 nM. High impulsivity, Large cue, 0 s: 74.85 ± 11.34 nM; small cue, 0 s: 52.29 ± 7.69 nM; large cue, 10 s: 44.32 ± 5.77 nM; small cue, 10 s: 43.01 ± 7.24 nM; large cue, 20 s: 37.20 ± 5.83 nM; small cue, 20 s: 30.13 ± 4.43 nM. Inset, The change in relative peak cue DA for the large reward cue from 0 to 20 s was smaller in impulsive rats, *p < 0.05. B, Percentage choice of the large/delayed reward significantly correlated with the change in relative peak cue DA for the large reward cue from 0 to 20 s.

