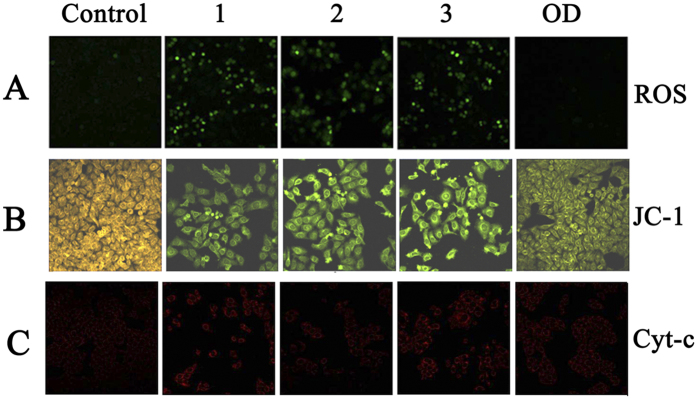
Figure 10. Fluorescence microscope analysis of the levels of ROS, ΔΨm and Cyt-c in HepG2 cells treated with 1–3.
(A) ROS generation images under a fluorescence microscope after treatment with 1–3 and OD at 1.0 μM for 24 h. (B) JC-1 staining images after HepG2 cells treatment with 1–3 and OD at 1.0 μM for 24 h. Selected fields illustrated the corresponding live cells (orange-red), apoptotic cells (green), and images were acquired using a Nikon Te2000 microscope. (C) Cyt-c images under a fluorescence microscope after treatment with 1–3 and OD at 1.0 μM for 24 h. (magnification 200x).

