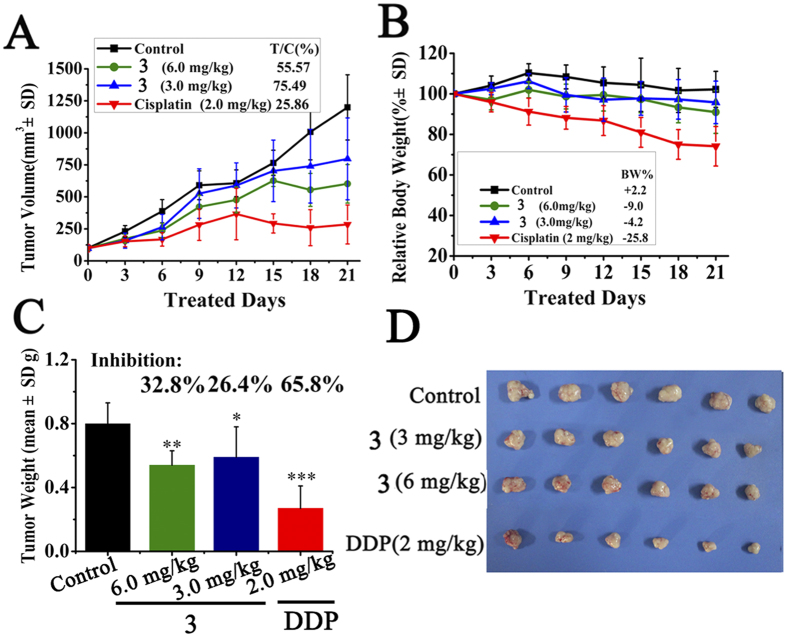
Figure 16. The in vivo antitumor activity of 3 in HepG2 xenograft model.
(A) Tumor volume growth trend of control group, 3-treated groups and cispaltin group. Tumor volumes were tracked by the mean tumor volume (mm3) ±SD (n = 6) and calculated as relative tumor growth rate [T/C%] values. (B) Tracking of body weight in mice during treatment. Relative body weight by considering the body weight on day 0 as 100%, the percent weight loss or gain was calculated on day 21. (C) Tumor growth inhibition rate. (*)P < 0.05, (**)P < 0.01, (***)P < 0.001, p vs vehicle control. (D) Photographs of tumor from treatment groups and vehicle group.

