
Figure 4. Effect OD and 1–3 on HepG2 cells cycle distribution.
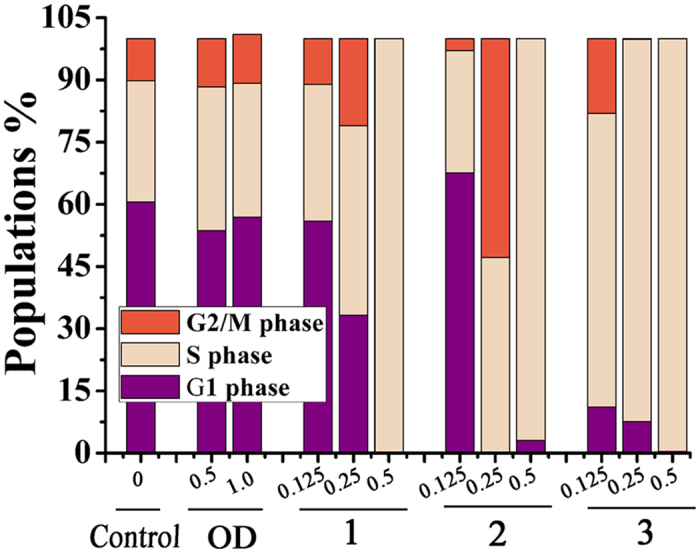
Cell cycle profiles were measured by flow cytometry after treating HepG2 cells with 1–3 (0.125, 0.25 and 0.5 μM) and OD (0.5 and 1.0 μM) for 24 h. Graph bars show the distributions of cells in different phases of cell cycle.