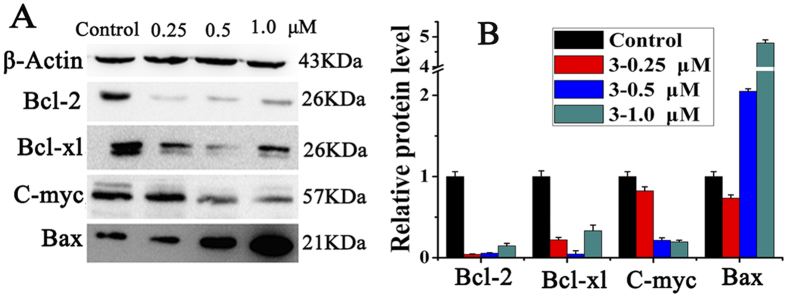
Figure 8. Effect of 3 on the apoptosis protein levels in HepG2 cells.
(A) Western blot analysis of Bcl-2, Bcl-xl, C-myc and Bax after treatment of HepG2 cells with 3 at 0.25, 0.5, 1.0 μM, respectively for 24 h. The apoptotic proteins were measured under the same experiment condition, and β-actin was used as the internal reference. (B) Densitometry analysis of Bcl-2, Bcl-xl, C-myc and Bax band from part A. The relative expression of each band = (density of each band/density of β-actin band). Mean and SD values were from three independent measurements.

