Figure 5.
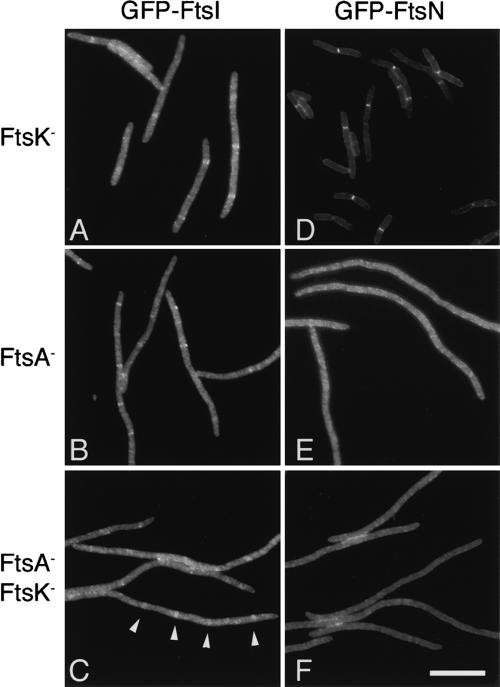
ZapA–FtsQ restores localization of FtsI, but not FtsN. Cells express either GFP–FtsI (A–C) or GFP–FtsN (D–F) from chromosomal constructs and are depleted for the cell division proteins FtsA and FtsK as indicated. All cells express ZapA–FtsQ from the λatt site. Representative images from paired samples are shown. Note the short cells in D, indicating suppression of the FtsK depletion by expression of GFP–FtsN. (C) Examples of rings in a doubly depleted cell are indicated by white arrowheads. A quantitative summary of results including control cells expressing wild-type FtsQ from the λatt site is presented in Table 1, rows 9–20. Bar, 10 μm.

