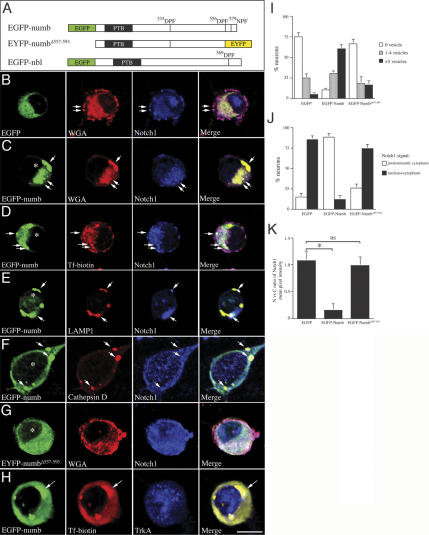
Figure 6.
Overexpression of Numb, but not Numb mutant lacking α-adaptin-interacting domain, leads to accumulation of markedly enlarged lysosomal vesicles and a reduction of Notch1 in the nucleus. (A) A Schematic diagram of constructs of wild-type Numb and Nbl, and mutant Numb in which the tripeptide sequences interacting with α-adaptin were deleted. (B) Expression of EGFP in sensory neurons had no effects in the distribution of endocytic vesicles and Notch1. Endocytic vesicles containing Notch1 were present in the cell surface (arrows) as well as in the cytoplasm. Significant amount of Notch1 was detected in the nucleus. (C–F) Expression of EGFP-numb led to accumulation of markedly enlarged vesicles in the cytoplasm. Most of these enlarged vesicles showed the properties of endosome (C,D, arrows indicate WGA and transferrin biotin-positivity in these vesicles, respectively) and lysosome (E,F, arrow shows the presence of LAMP1 and cathepsin D). Neurons expressing EGFP-numb showed a very low level of Notch1 in the cytoplasm and nucleus (* in C–F). Many of these neurons also showed accumulation of Notch1 in the enlarged vesicles (arrows in C–F). (G) Deletion of the α-adaptin-interacting tripeptide sequences in the C terminus of Numb abolished the effects of Numb to induce lysosome formation. (H) The Numb-induced lysosomal vesicles showed accumulation of transferrin-biotin (arrows) without affecting the presence of TrkA vesicles. (I) Quantitative analyses of the percentage of neurons that contained more than one vesicle (<1 μm diameter). Expression of EGFP-Numb, but not Numb mutant without the α-adaptin-interaction domain, induced many markedly enlarged vesicles in the cytoplasm. (J) Quantitative representation of the percentage of neurons that showed a predominant Notch1 staining in cytoplasm or in both nucleus and cytoplasm. (K) The nuclear to cytoplasmic ratios of Notch1 were presented by measuring the mean pixel intensity using Leica Confocal Software. Paired Student's t-tests were used to compare the difference of Notch1 signal intensity between neurons expressing EGFP, EGFP-Numb, or EYFP-NumbΔ557–593. Bar: H, 7 μm.

