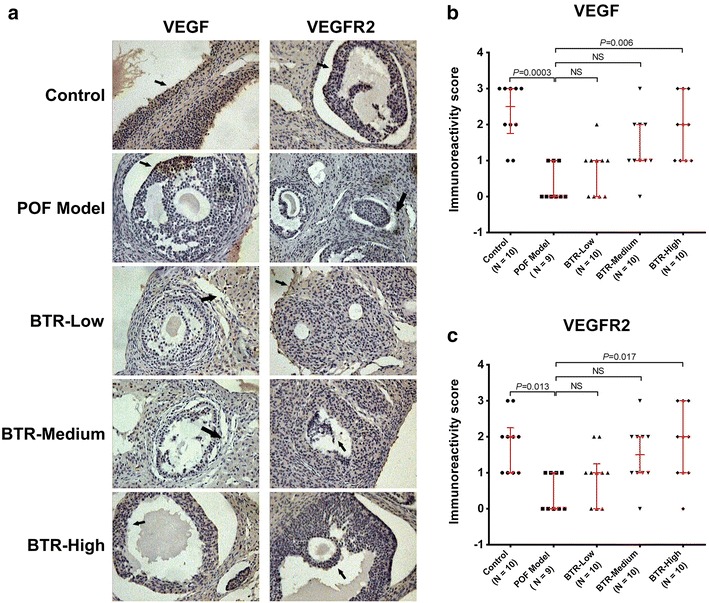
Fig. 3.

Representative immunohistochemistry images (a) and quantitative analysis (b, c) of VEGF and VEGFR2 in histological sections from all experimental groups. Immunostaining (brown) are indicated by black arrows. For each animal, ten random high power fields (HPFs) from five sections were used for quantitative analysis. Each dot in b and c represents the median value across these HPFs. Bars and error bars are medians and quartiles, respectively. All statistical analyses were performed using nonparametric Kruskal–Wallis test followed by Dunn’s post hoc test. NS not significant. Magnification ×100
