
Fig. 4.
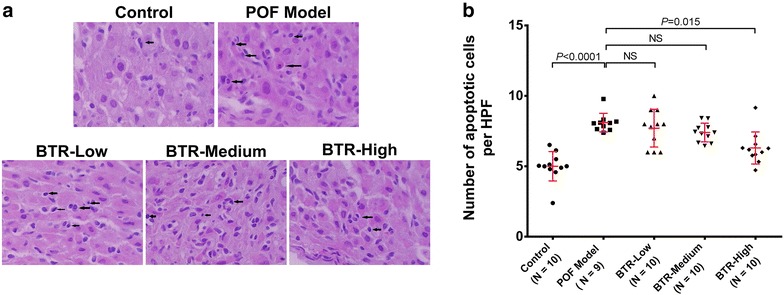
Quantitative assessment of apoptosis in ovarian tissue samples from different experimental groups. a Representative hematoxylin and eosin-stained images and b apoptotic cell counting results. For each animal, ten high power fields (HPFs) were randomly chosen from five sections for counting the number of apoptotic granulosa cells. Each dot in b represents the average value across these HPFs. Bars and error bars are means and SD, respectively. All statistical analyses were performed using ANOVA followed by Tukey’s post hoc test. NS not significant. Magnification ×400