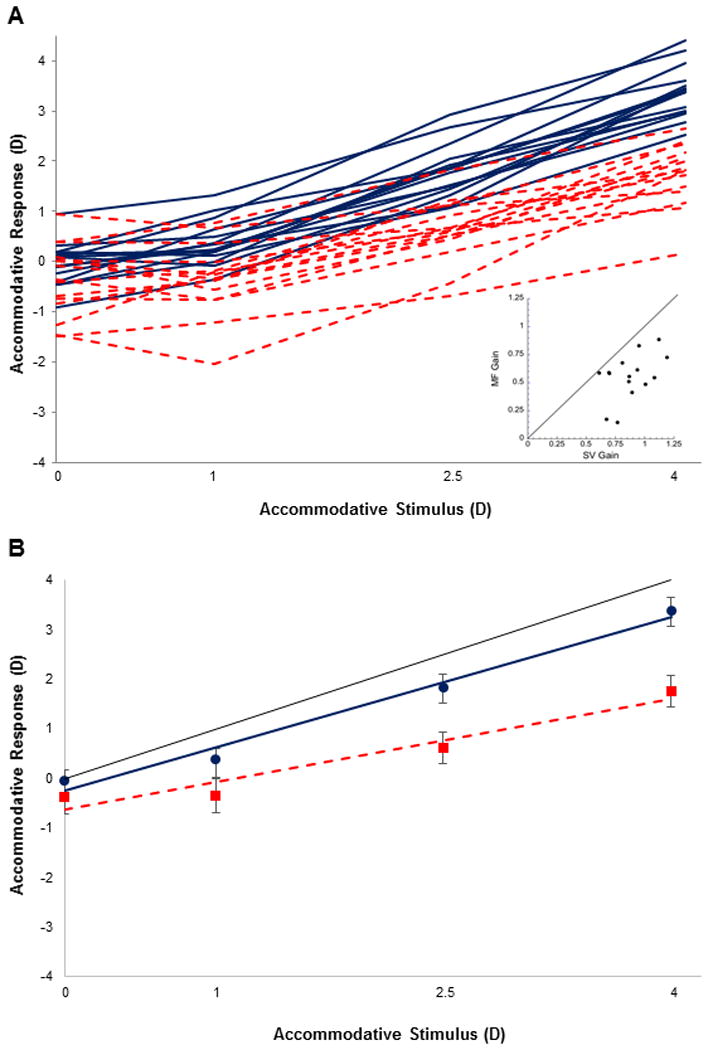
Figure 1.

(A) Accommodative responses for subjects wearing single vision (blue solid) and multifocal (red dashed) contact lenses. Inset shows the gain of the accommodative stimulus response function for each subject while wearing either single vision or multifocal contact lenses (n=15). (B) Mean (± standard deviation) accommodative response at each stimulus demand and mean accommodative stimulus response function for single vision (blue) and multifocal (red) contact lens conditions. The black solid line shows the 1:1 line.
