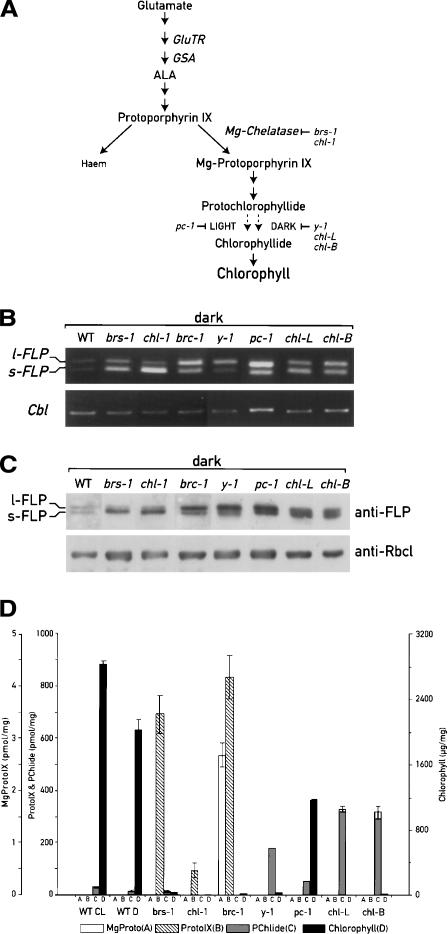
Figure 6.
Analysis of expression of FLPs and pigment accumulation in the wild-type strain and chlorophyll biosynthesis mutants. (A) Schematic representation of chlorophyll biosynthesis pathway and the steps blocked in the mutants analyzed. (B) RT–PCR analysis performed with oligonucleotides specific for the FLPs, as indicated in Figure 1, and for the G protein (Cbl) as control. (C) Immunoblot analysis using FLP antiserum and anti-RbcL as control. (D) Quantification of the pigment content by HPLC. All the pigments were normalized relative to the dry weight of cell pellets.

