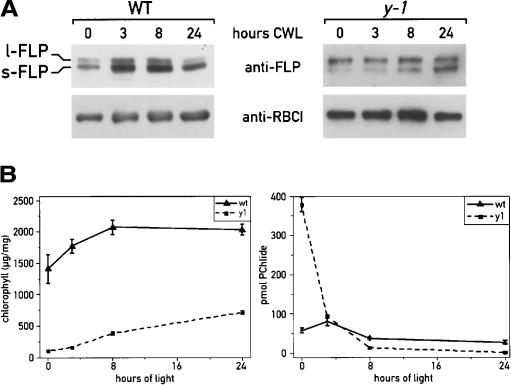
Figure 7.
Analysis of FLP isoforms in wild-type and y-1 mutant cells grown in the dark and after a dark-to-light transition (CWL, continuous white light). The level of FLP proteins was determined by immunoblot analysis (A) and the content of PChlide and chlorophylls extracted from the cells at different time points was estimated by HPLC (B).

