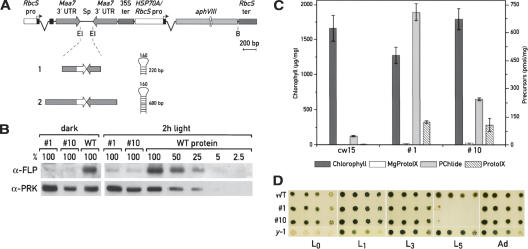
Figure 8.
Reduction of FLP levels by RNAi. (A) Schematic representation of the constructs used for the transformation. The FLP fragments were cloned in sense and antisense orientation between the Maa7 inverted repeat. The different FLP cDNA fragments used to generate the constructs 1 and 2, and the predicted structure of the resulting hairpin RNAs are indicated. (B) Analysis of FLP protein levels by immunoblotting in two independent RNAi strains (clones 1 and 10), generated with constructs 1 and 2, respectively. The FLP content was analyzed in cells grown in the dark for 12 h or exposed to the light for 2 h. Twenty micrograms of protein from each extract was used, and the level of FLPs was quantified using a serial dilution of proteins from wild-type cells as standard. Membranes were incubated with FLP antiserum and PRK (phosphoribulose kinase) antibody as control. (C) Quantification of pigments of wild-type cells and RNAi strains 1 and 10 grown in the dark for 3 d by HPLC. (D) Growth test to assay the light sensitivity of the RNAi strains. Strains 1 and 10 were grown for 3 d in the dark, spotted on TAP plates with serial dilutions (1:5), and grown under different light conditions for 1 wk (L0, dark; L1, 7.5 μmol m–2 sec–1; L3, 90 μmol m–2 sec–1; L5, 600 μmol m–2 sec–1) or progressively exposed to increased light intensity with five adaptation steps of 2 d each (Ad:L1,7.5 μmol m–2 sec–1; L2, 37 μmol m–2 sec–1; L3, 90 μmol m–2 sec–1; L4, 200 μmol m–2 sec–1; and L5, 600 μmol m–2 sec–1h). Cells from wild-type and y-1 mutant strain were subjected to the same treatments.

