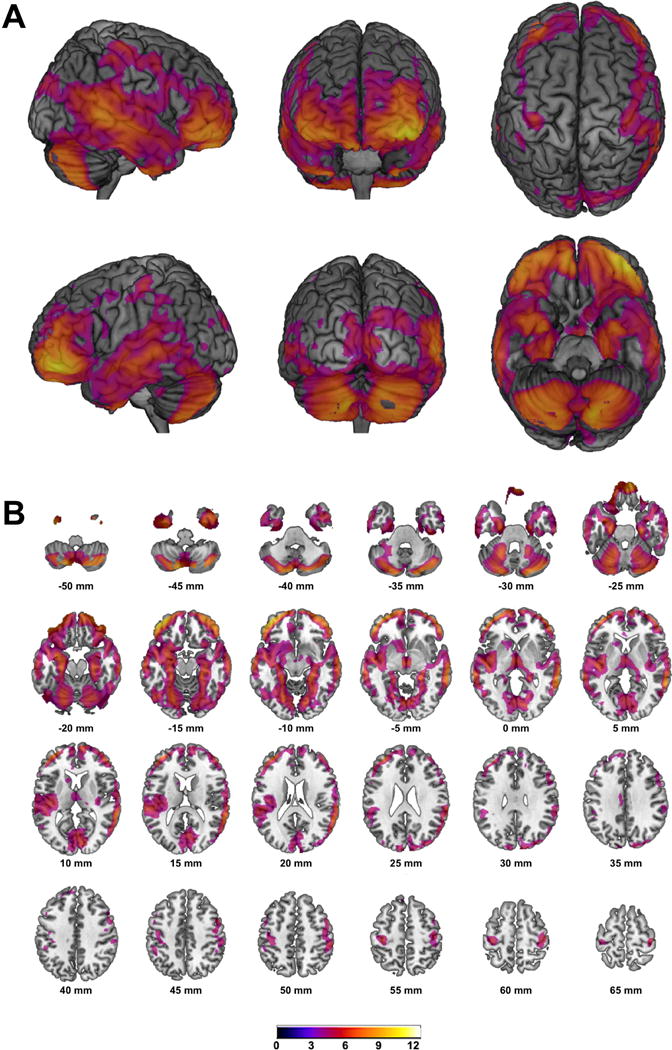
Figure 2.

T-score maps of regional GMV negatively associated with BMI superimposed on high resolution rendered images of the brain (A) and on slices within the axial plane (B) with corresponding locations on the z-axis below; Maps are thresholded at p<0.05 whole brain corrected on the voxel-level (FWE); Color bar indicates t-score;
