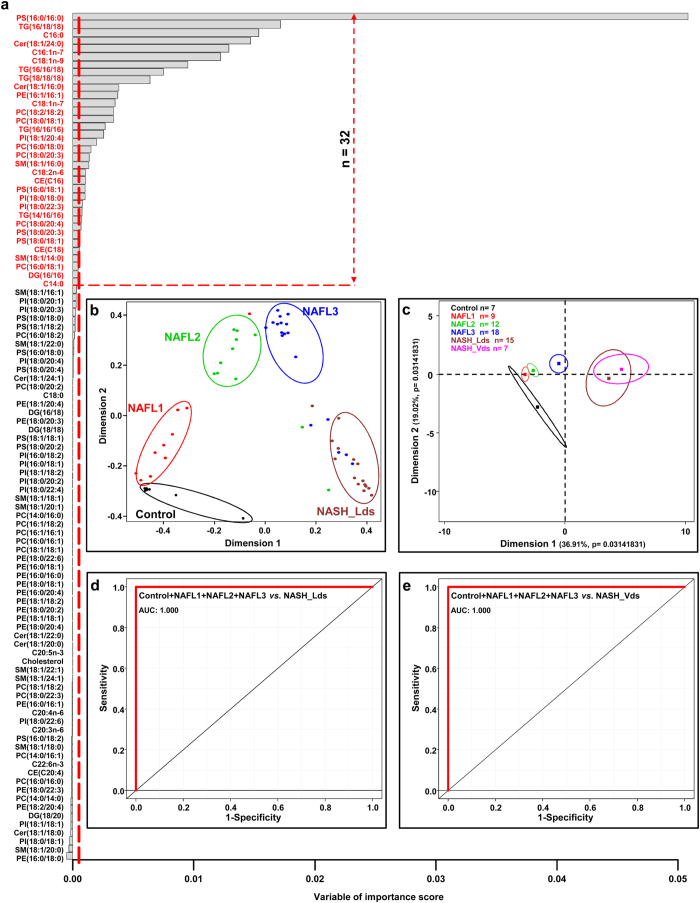
Figure 1. Selected lipids using random forests analysis discriminate NASH patients.
(a) Data are represented as a bar plot of a matrix with 104 lipids (column) analyzed by mass spectrometry and ordered based on their variable of importance score. The threshold in the x-axis is calculated as the absolute value of the less abundant lipid represented as vertical red dot line. Discriminant lipids (n = 32) are those over the horizontal red dot line. Random forests analysis was run with the 5 groups of patients. (b) Multidimensional scaling plot discriminating NASH_Lds group from Control, NAFL1, NAFL2 and NAFL3 groups based on random forests results. (c) Principal component analysis based on the 32 lipids identified discriminating specifically NASH patients (NASH_Lds). Lines are the ellipses centered to the mean (colored squares) representing 95% interval confidence, and p the probability associated with the F- test of the analysis of variance along the axes. ROC curves based on the 32 lipids combined comparing (d) NAFLD groups of patients (i.e. Control + NAFL1 + NAFL + NAFL3) and NASH group (NASH_Lds) from Paul Brousse Hospital, and (e) NASH group (NASH_Vds) from L’cc. • Control n = 7;  NAFL1 n = 9;
  NAFL2 n = 12;
  NAFL3 n = 18;
  NASH_Lds n = 15,
  NASH_Vds n = 7. AUC: Area under the curve; CE: cholesteryl ester; Cer: Ceramides; DG: diacylglycerols; NAFL: nonalcoholic fatty liver; NASH: nonalcoholic steatohepatitis; PC: Phosphatidylcholines; PE: Phosphatidylethanolamines; PI: Phosphatidylinositols; PS: Phosphatidylserines; PV: predictive value; SM: Sphingomyelins, TG: triglycerides.

