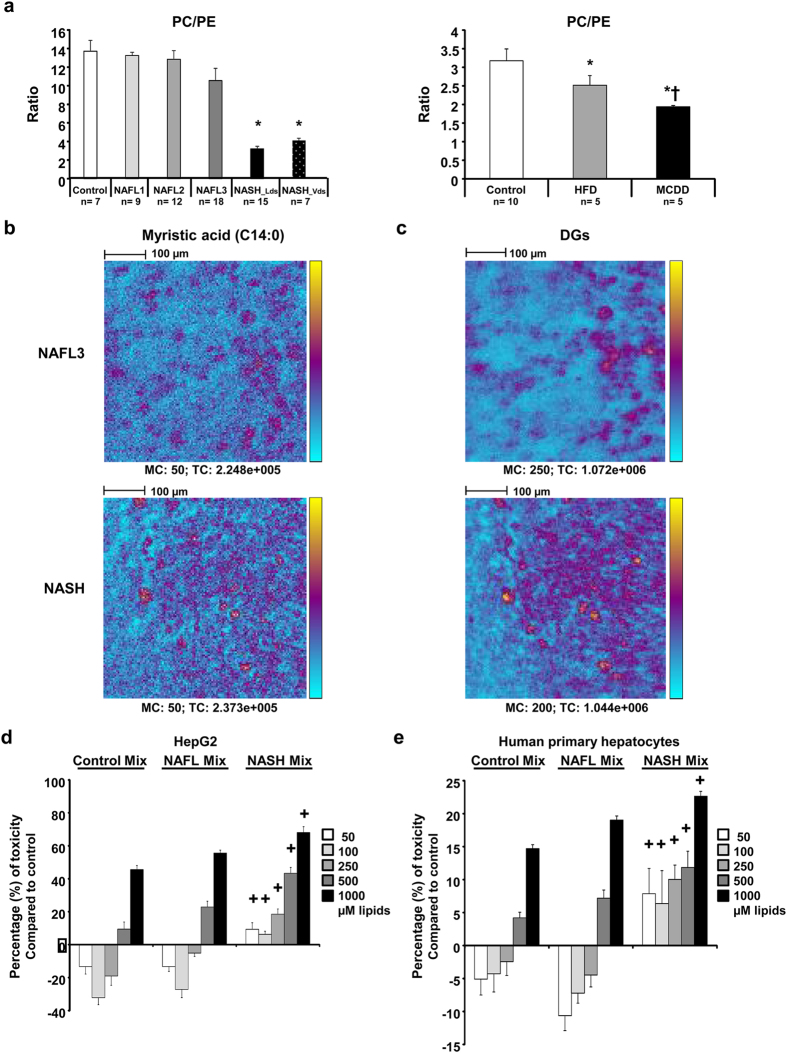
Figure 6. Membrane integrity is disrupted in NASH patients and mice leading to release of lipids in parenchyma.
(a) Phosphatidylcholine (PC) to phosphatidylethanolamine (PE) ratio in the patients studied (left panel) and mouse models (right panel). (b) Myristic acid (C14:0) and (c) sum of all diacylglycerols (DG) liver contents in NAFL3 and NASH patients. Both selected patches regarding myristic acid were matched according to the total count (TC). Each patch is representative of the 6–12 patches recorded from central vein to portal triad. Between 2 to 3 slices per sample were processed. Color scale bar with amplitude in number of counts are indicated to the right of each image. Field of view of 500 μm × 500 μm. Scale bars: 100 μm. Data are means ± SEM. *p < 0.05 by unpaired t-test compared to Control group and †p < 0.05 by unpaired t-test compared to NAFL groups after ANOVA analysis. Control n = 7; NAFL1 n = 9; NAFL2 n = 12; NAFL3 n = 18; NASH_Lds n = 15, NASH_Vds n = 7 and Control n = 20; HFD n = 5; MCDD n = 5 mouse males. (d) HepG2 cell and (e) human primary hepatocytes treated with lipid mixes at different concentrations. Cells are treated in triplicate during 24 h with 50. 100. 250. 500 and 1000 μM final concentration of lipids with lipid mixes (Control Mix. NAFLD Mix. NASH Mix) based on the percentage of C14:0, C16:0, C16:1n-7, C18:1n-7, and C18:1n-9 found in liver tissues of control. NAFL2/3 and NASH patients. Two independent experiments were done. Data are mean ± SEM. +p < 0.05 by unpaired t-test compared to Control Mix and NAFL Mix at the same concentrations after ANOVA test.

