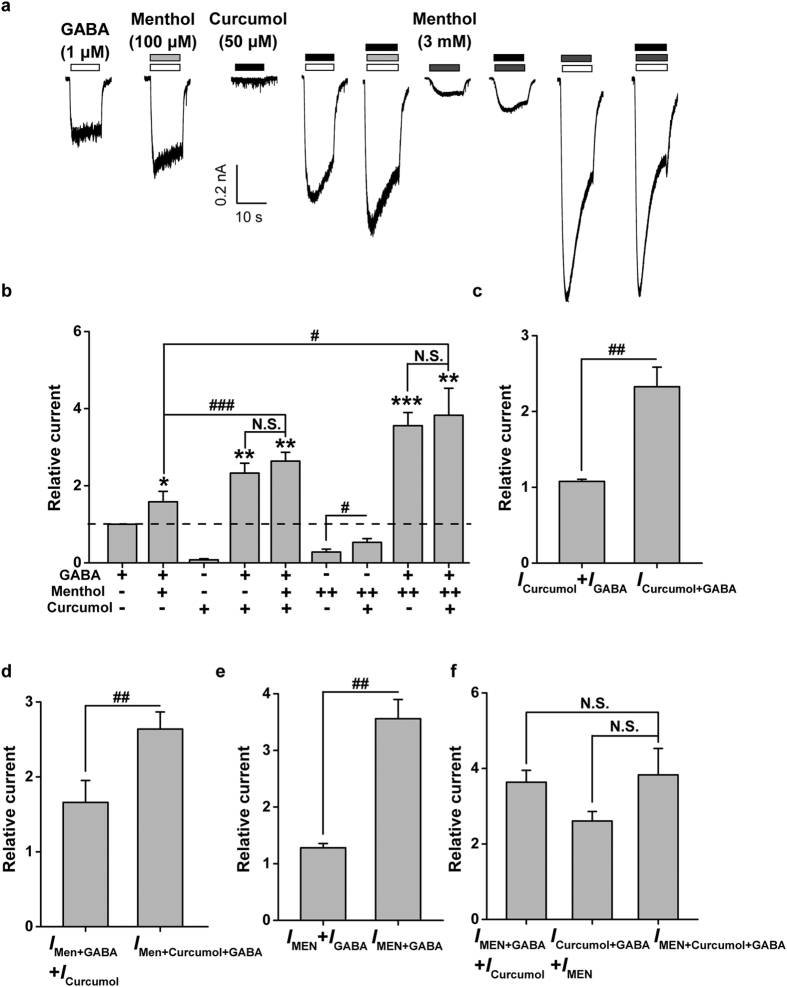
Figure 3. Interplay between menthol and curcumol on GABA-induced currents in cultured hippocampal neurons.
(a) Representative current traces induced by GABA (1 μM) in the absence or presence of menthol (100 μM or 3 mM) or curcumol (50 μM). (b) Pooled data from (a). Menthol: (+), 100 μM; (++), 3 mM. (c–f) Histograms showing relative ICurcumol, IGABA, ICurcumol+GABA, IMen+GABA, IMen+Curcumol+GABA, IMEN, IMEN+GABA, and IMEN+Curcumol+GABA. ICurcumol, curcumol-activated current; ICurcumol+GABA, curcumol plus GABA-activated current; IGABA, GABA-activated current; IMen+GABA, menthol (100 μM) plus GABA-activated current; IMen+Curcumol+GABA, menthol (100 μM), curcumol, plus GABA-activated current; IMEN, menthol (3 mM)-activated current; IMEN+GABA, menthol (3 mM) plus GABA-activated current; IMEN+Curcumol+GABA, menthol (3 mM), curcumol, plus GABA-activated current. Data represent peak current amplitude normalized to that induced by GABA (1 μM) alone (dashed line). n = 5 each group. *P < 0.05, **P < 0.01, ***P < 0.001, compared with the current induced by GABA alone (dashed line); N.S., not significant, #P < 0.05, ##P < 0.01, ###P < 0.001, compared as indicated, paired Student’s t-test.

